What is the opposite of Pmeanrand?

Hey y’all.
I thought that Pgauss would be the opposite of Pmeanrand.
I am surprised that Pgauss yields negative values in the below example:

(
SynthDef(\saw, {
		arg dur, atk = 0.01, rel = 1.0,
		t_gate = 1, out, freq = 442, lpf = 5500,
		rq = 1, pan = 0.0, amp = 0.5;
		var env = EnvGen.kr(Env.perc(atk, rel), t_gate, timeScale: dur, doneAction: 2);
		var sig = Saw.ar(freq: freq, mul: env);
		sig = RLPF.ar(sig, lpf.clip(20.0, 20000.0), rq.clip(0.0,1.0));
		sig = Pan2.ar(sig, pan);
		Out.ar(out, sig * amp);
	}).add;
)

(
Pdef(0,
    Pbind(*[
        instrument: \saw,
        rps: Phprand(5, 11),
        freq: 100 * Pstutter(Pkey(\rps), Plprand(1, 9)),
        lpf: Pkey(\freq).expexp(100, 900, 800, 1600),
        dur: 1 / Pstutter(Pkey(\rps), Phprand(5, 11)),
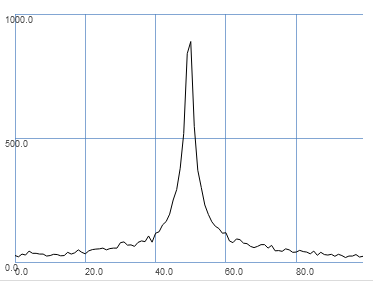
        amp: Pgauss(0.5, 0.5).trace,
        rel: Phprand(9.0, 13.0),
        pan: Pmeanrand(-1.0, 1.0),
    ])
).play
)

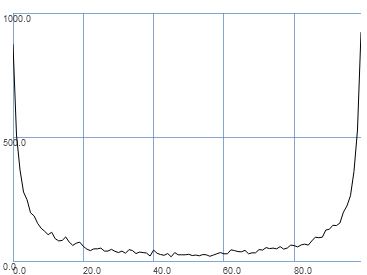
If Pgauss is behaving as intended let me move on to my actual question. What is the opposite of Pmeanrand?

What I, as a user would like to do is this:

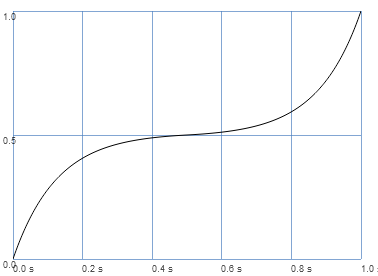
Pbellcurve(0.0, 1.0) <–[Fantasy Pattern object]

and for that to yield values from 0.0 to 1.0 where 0.5 is most likely to occur.

Any help greatly appreciated.

What is the opposite of Pmeanrand ?

Why do you say the “opposite of” Pmeanrand? It seems to do what you want, pretty much…

[…] to yield values from 0.0 to 1.0 where 0.5 is most likely to occur

I think Pmeanrand does what you want, except with a triangular-shaped distribution (straight ramp up from min to mean and down from mean to max). Values close to 0.5 are more likely than values near 0 or 1. A Gaussian random distribution has no guaranteed minimum or maximum limits, although you can choose a standard deviation such that it is extremely unlikely to fall outside a given range (you could then clamp it to avoid going outside). Another alternative might be to use Pfunc with one of the other (non-Pattern) random generation functions, for example sum3rand sums three uniform distributions and gives a pretty close approximation to a Gaussian curve, while respecting a “hard” min and max…

(~distribInfo = { arg vals;
	"min: % mean: % max: %".format(
		vals.minItem.round(1e-4), vals.mean.round(1e-4), vals.maxItem.round(1e-4)
	).postln;
	vals.histo.plot
})

// Gaussian shape where three standard deviations -- about 99.7% -- will stay within 0..1 range
~distribInfo.(Pgauss(0.5, 1/6).asStream.nextN(10000))
// Example output: min: -0.25955 max: 1.17854

// clipped Gaussian...changes the probability distribution but avoids "bad" values
~distribInfo.(Pgauss(0.5, 1/6).clip(0,1).asStream.nextN(10000))
// Example output: min: 0.0 max: 1.0

// linear/triangular distribution
~distribInfo.(Pmeanrand(0.0, 1.0).asStream.nextN(10000))
// Example output: min: 0.0041868 max: 0.99034

// pseudo-Gaussian with fixed limits
~distribInfo.(Pfunc{ 0.5.sum3rand + 0.5 }.asStream.nextN(10000))
// Example output: min: 0.01724 max: 0.9775

Hope that helps,
Glen.

2 Likes

One other fun trick is you can use something like an Env to design a lookup function for your output values, and thus get any kind of weird distribution you might like. An example that would have a very “sharp” Gauss-like curve around the value 0.5, but that would also be guaranteed to never output values outside the 0…1 range, would be something like this:

// Weird distribution using Env
~distribInfo.(Pfunc{ Env([0, 0.5, 1], [0.5, 0.5], [-4, 4]).at(1.0.rand) }.asStream.nextN(10000))
// Example output: min: 0.0005136 max: 0.9998975

image

The lookup envelope itself looks like this (Env([0, 0.5, 1], [0.5, 0.5], [-4, 4]).plot), notice how it’s more likely to stick close to the value 0.5:
image

Glen!
Thank you so much for taking the time to teach me.
This is very, very cool stuff.
Love the the lookup envelope solution.

I realize now that I was nervous about posting and messed up my question.
I still want the opposite of Pmeanrand which i am dreaming would have the minimum and maximum value very likely and the middle value very unlikely.

In the Env example, you can just switch the sign of the curves from [-4, 4] to [4, -4] (or maybe less extreme, like [3, -3] if you prefer) and you’ll have such a distribution:

~distribInfo.(Pfunc{ Env([0, 0.5, 1], [0.5, 0.5], [4, -4]).at(1.0.rand) }.asStream.nextN(10000))

image

Great!
Thank you very much for all your help and patience.
This is now solved.
This is very custom / bespoke. I respect that.

Still tho, if anyone is aware of a Pattern object that does the opposite of Pmeanrand I’d love to hear about it.

In case someone finds this in the future, please find below totalgee’s solution applied to my example:

(
SynthDef(\saw, {
		arg dur, atk=0.01, rel=1.0,
		t_gate=1, out, freq=442, lpf=5500,
		rq=1, pan=0.0, amp=0.5;
		var env = EnvGen.kr(Env.perc(atk, rel), t_gate, timeScale: dur, doneAction: 2);
		var sig = Saw.ar(freq: freq, mul: env);
		sig = RLPF.ar(sig, lpf.clip(20.0, 20000.0), rq.clip(0.0,1.0));
		sig = Pan2.ar(sig, pan);
		Out.ar(out, sig * amp);
	}).add;
)

(
Pdef(0,
    Pbind(*[
        instrument: \saw,
        rps: Phprand(5, 11),
        freq: 100 * Pstutter(Pkey(\rps), Plprand(1, 9)),
        lpf: Pkey(\freq).expexp(100, 900, 800, 1600),
        dur: 1 / Pstutter(Pkey(\rps), Phprand(5, 11)),
        amp: Pfunc{ Env([0, 0.5, 1], [0.5, 0.5], [4, -4]).at(1.0.rand) }.trace,
        rel: Phprand(9.0, 13.0),
        pan: Pmeanrand(-1.0, 1.0),
    ])
).play
)

You can define a helper class to implement this in a more general way (I think I’ll add it to Bacalao ;-). To use, just paste this code into a file with the .sc extension and in your Extensions directory, then recompile the class library.

// @totalgee's Envelope-based random generator, with adjustable steepness (slope).
// Set negative slope to "stay away" from the mean instead of staying close to it.
// If you set a custom "mean", you can make it asymmetric, so the peak
// (or valley) is shifted (but always within the range lo..hi).
Pmeanrand2 {
	*new { arg lo = 0.0, hi = 1.0, slope = 2, mean = nil;
		var meanParam, env;
		mean = (mean ?? { lo + hi / 2 }).clip(lo, hi);
		meanParam = mean.linlin(lo, hi, 0, 1);
		env = Env([lo, mean, hi], [meanParam, 1.0 - meanParam], [slope.neg, slope]);
		^Pfunc{ env.at(1.0.rand) };
	}
}

Example usage – modifying one line your Pbind example from above:

		// amp: Pfunc{ Env([0, 0.5, 1], [0.5, 0.5], [4, -4]).at(1.0.rand) }.trace,
		amp: Pmeanrand2(0, 1, -4).trace,

Glen.

1 Like

This is awesome!
Works like a charm.
So elegant.
This should be in the vanilla distribution.
I love it.
Thank you so much for making it.
This is now a cherished extension.

1 Like