I’m trying to experiment with the XLine UGen. When I run the following line of code:
{XLine.ar(1.0, 2.0, 1.0, 1.0)}.plot;
I get this:
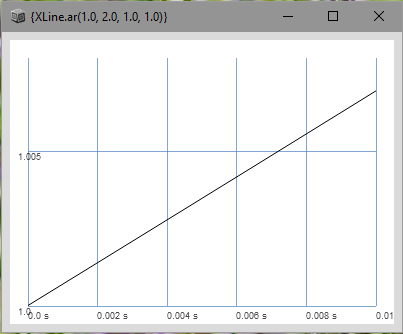
which looks more like a straight line than an exponential curve. What am I missing? Do I need to do something to change the plot window?
If you don’t provide the .plot method with a duration argument, it will only plot 0.01 seconds by default.
You can tell by the x-axis (domain) labels. Over that short duration, the exponential curve will look approximately linear.
{ XLine.ar(1.0, 2.0, 1.0, 1.0) }.plot(duration: 1); // plot entirety of XLine dur, exp curve clearly visible
1 Like