Again, a simple question.
I was wondering if I could use lincurve for negative numbers, and thus if I could plot the transfer function, with values from -1.0 to 1.0 on the x-axis, and x.lincurve(-1.0, 1.0, -1.0, 1.0, 4) on the y-axis.
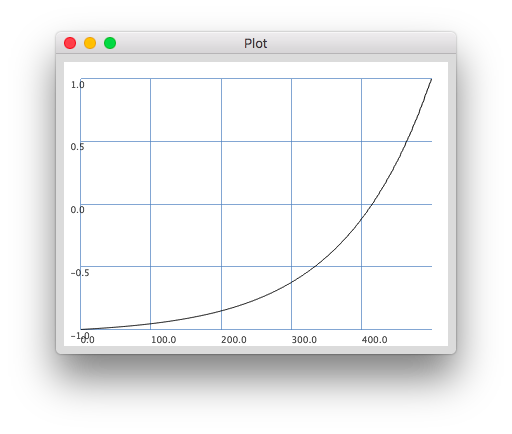
{ |x| x.lincurve(-1,1,-1,1,4) }.plotGraph(from: -1, to: 1));
does more or less what I want, plot the transfer function, but the x-axis displays the number of values (500, the default for plotGraph), not the x-axis values I wanted.
Any idea to set to the x-axis values in the plot window ?
That might be considered a bug. For everything else in Common\GUI\PlusGUI\Math\PlotView.sc the plot returns the Plotter. I don’t quite buy that it needs to be special for plotGraph and return the function, but maybe it was intended to work like trace so you can chain-plot the function and still use it in the same expression. But unlike for trace that doesn’t seem incredibly useful for plotGraph… especially since/if you need to customize the axis, as you found.
By the way, the fact that Function.plot creates a synth and plots that can also be confusing. Some “smarts” to detect if it creates a UGen or not could be implemented, and plot locally (i.e. plotGraph) when there’s no UGen [instead of bombing with an obscure error, while still popping a window].