Maybe it’s a stupid question, but can you change Supercollider’s bit depth? I would like to have more resolution in the frequency range so would like to increase the current bitrate I am working on… I work on SC 3.9 on mac. I currently export at 32bit and would like 64bit…
To increase frequency resolution, you would want to increase sample rate, not bit depth. Sample rate can be set using ServerOptions.
Bit depth would give you more dynamic range, meaning more or less a greater possible range between your quietest and loudest sound. However, even for that case, regular floats have a range that is significantly better than any audio equipment you or I own, and better than our ears in any normal situation. Doubles are occasionally used for internal values when calculating some filters etc, because they can be more sensitive to small changes, but you would more or less never use doubles for saving audio recordings, or for a general audio pipeline (except in special cases where you have digital processed outputting wild dynamic ranges and for some reason want to capture these without normalizing).
It was a stupid thing to consider that bitrate would make a difference in the frequency. Basically I understood that I must have describd my problem in a wrong may.
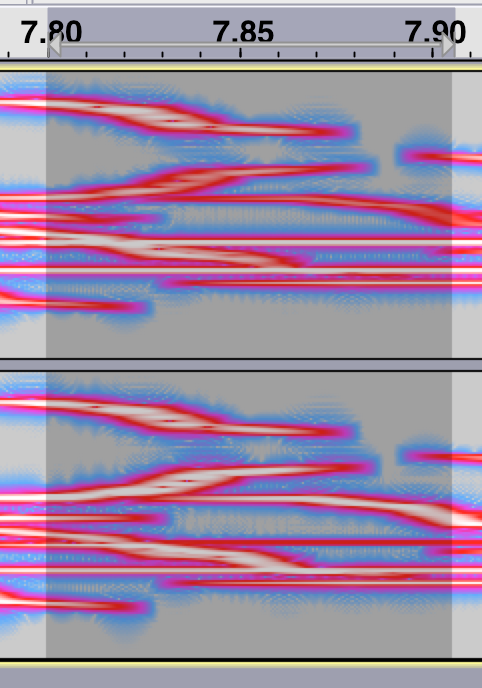
Basically I have noticed that when I use a simple SinOsc and then open it in Audacity, in view in Spectogram mode with settings of 8000hz and window size 2048. The lines frequency line become extremely thick, where as in different audio files that I use for reference, lines are much more subtle (while using the same settings for visualization). For this I though there was something wrong with the resolution of the sound. I have attached some pics for refference…
Would you know why is that? By changing sample rate the lines wont become thiner…
Could this be related to amplitude? If you use just SinOsc.ar() then you are maxing out on amplitude, which creates thicker lines.
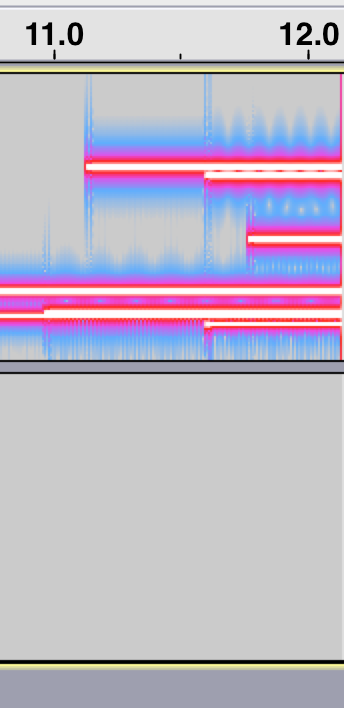
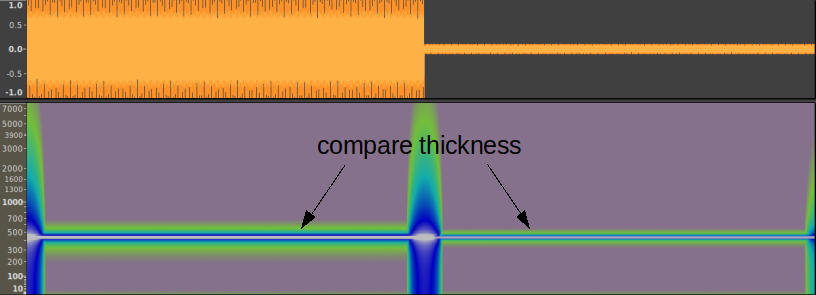
Here is for example a spectrogram for this code:
{SinOsc.ar() * [1,0.01]}.play // full amp on left, -40dB on right
Thank you for your answer! Unfortunately I do not think it is an amplitude reason why this is happening. Since by increasing amplitude The thickness of the line should not change, only its color intensity should change. I do not understand why this is happening. It is as if (at least on the visualization part) the frequency is not just one but there is an offset making the line thick…
In the example you posted indeed the line seems thinner, but also fades out. I did some tests with various amplitudes and the thickness persists just with less color intensity
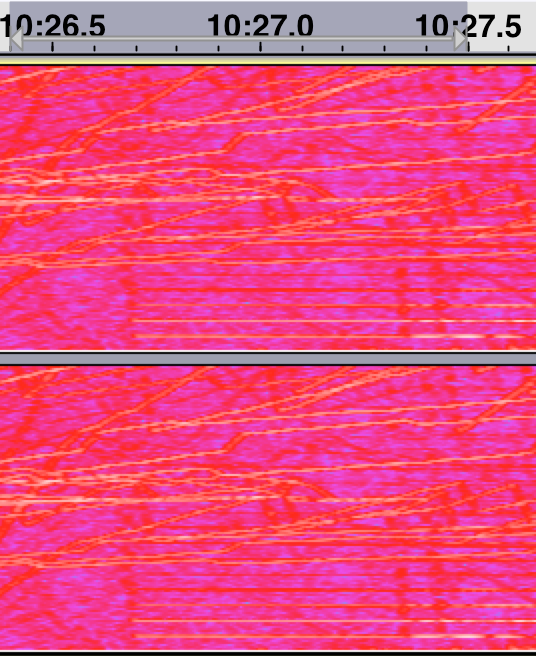
Initially I had seen this that’s why I thought it’s an issue of bitrate. Since as you can see in the third image the colors are there but are somehow grouped creating bigger areas, something that is similar to the effect that is shown at the images of the spectrogram.
When you FFT a sine wave, you probably think that it contains only one sine component. But this isn’t true.
The FFT frame applies a windowing function, so it isn’t a pure sine. The windowing function will be represented in FFT by energy “leaking” away from the principal frequency.
If the frequency does not match an exact integer division of the sample rate, then the FFT itself (apart from the windowing function) must “leak” energy into other bins.
If the amplitude is lower, then these leaked bins will appear in the spectrogram as darker colors and you won’t see them as strongly. When you use a full-scale signal, the leaky bins will be brighter = more visible = line appears to be thicker.
I agree with the amplitude theory. Often people think that a discrete Fourier transform identifies the exact frequencies present in the original sound. It doesn’t. The relationship between the sounding frequencies and the Fourier representation is… strange. The “thickness” effect that you’re describing doesn’t surprise me at all, frankly.
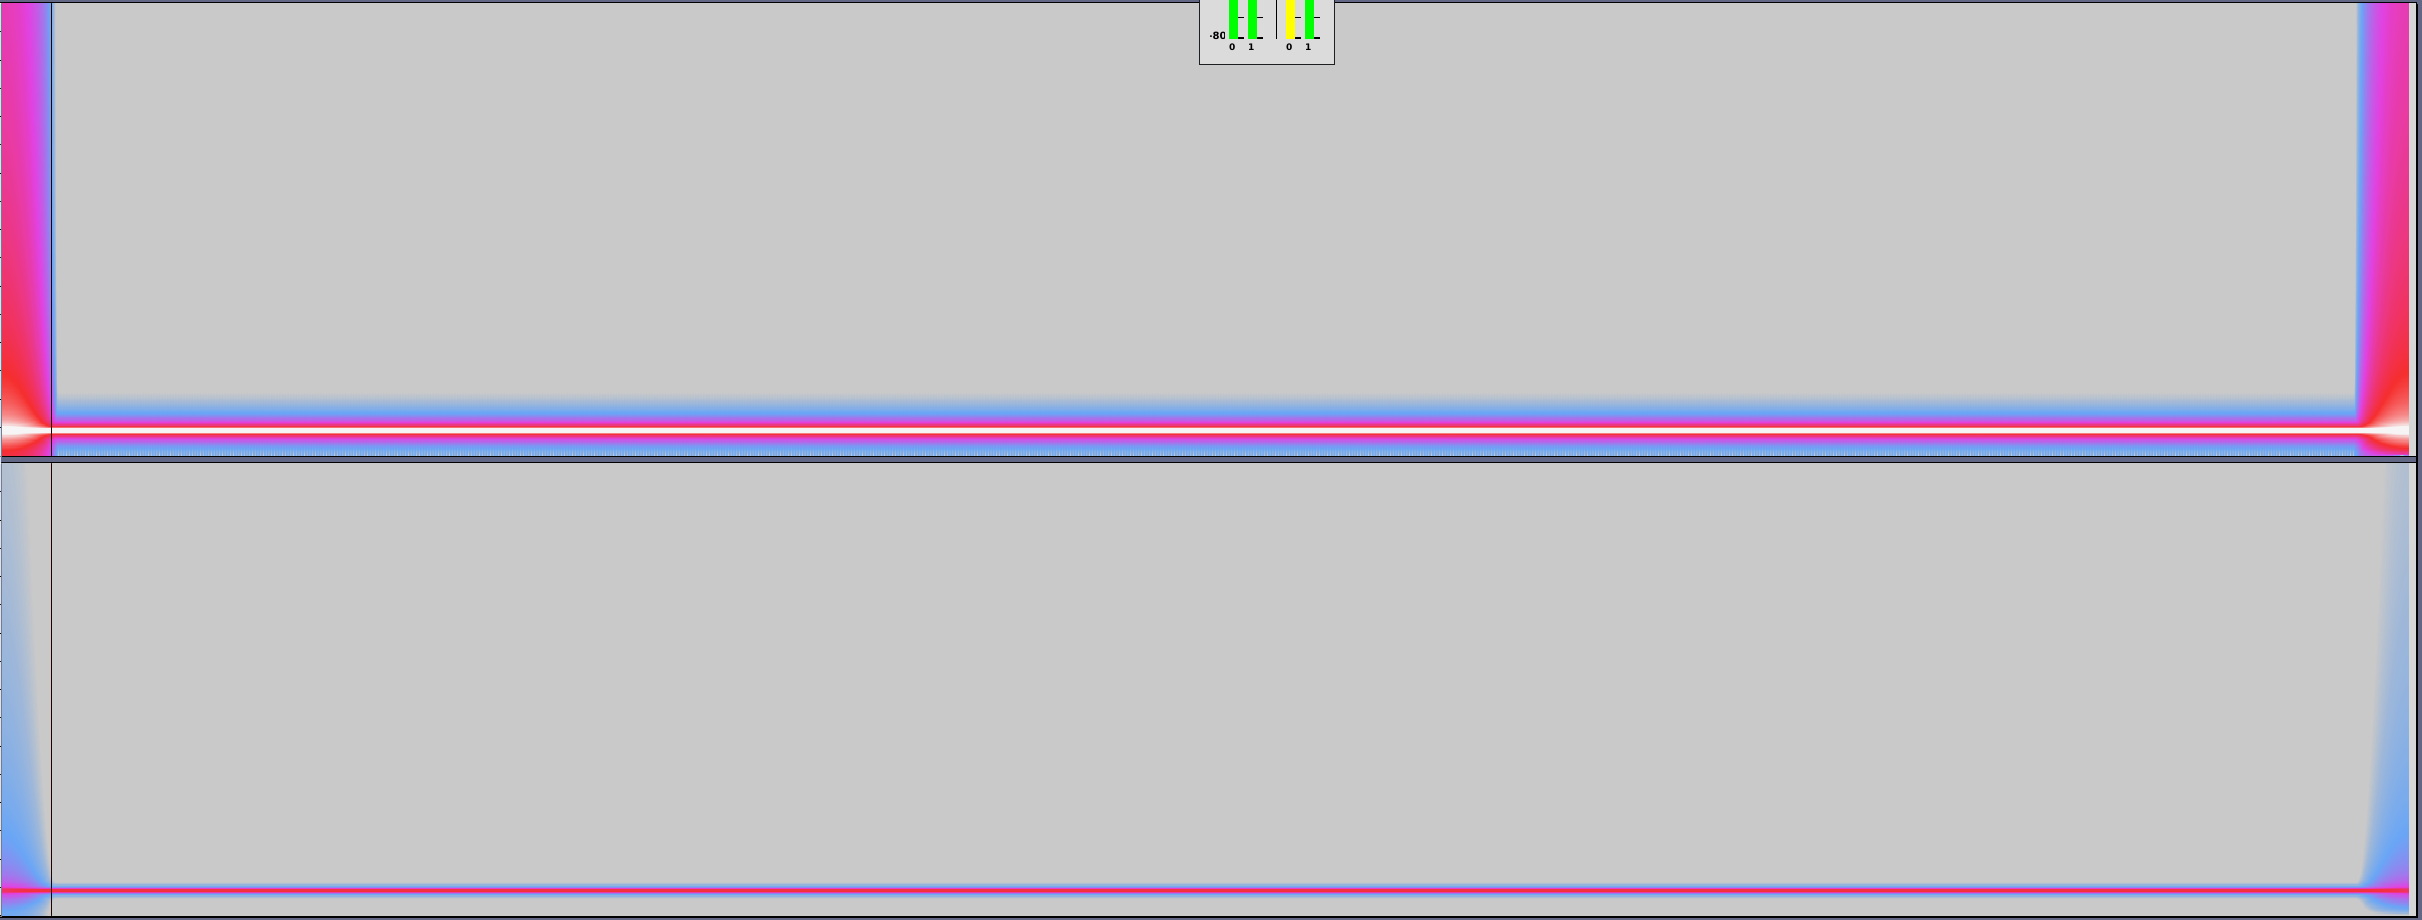
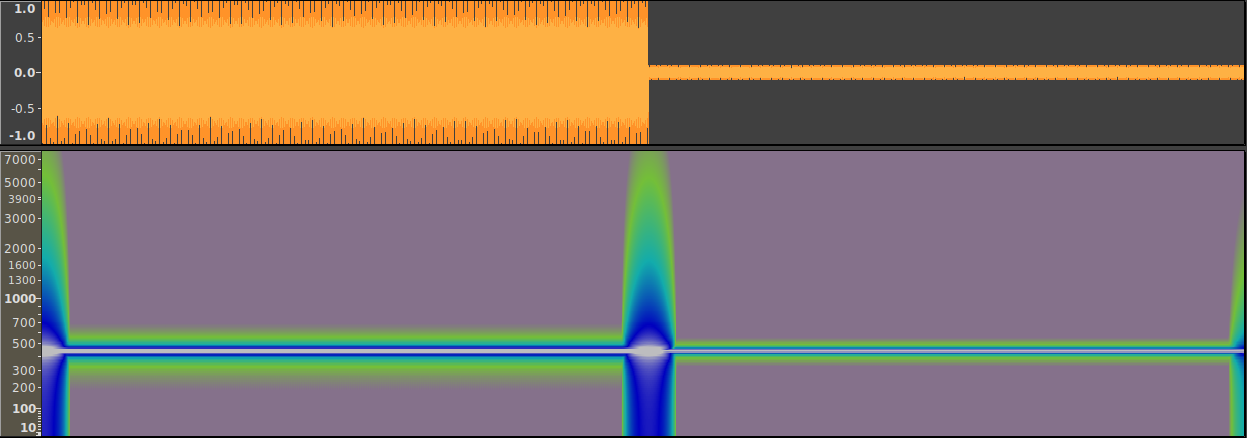
I’d suggest to test it empirically. If you’re right, then you can record a quieter sinusoid from SC, view the spectrogram, and the line will be darker but not thinner. If the amplitude theory is right, then reducing the amplitude will make the line look like what you saw elsewhere.
So, try it.
Also the audio that is exported is a 32bit aiff. Could it be made 64bit?
As stated before, 1/ there’s basically no audio app that uses 64 bit samples and 2/ it will not accomplish anything useful except to waste massive amounts of disk space (which is the reason why there aren’t any apps using this format).
That is conclusive: the spectrogram line for the louder signal appears to be thicker than the line for the quieter signal. I’m sure this is because Audacity has an magnitude threshold – when a bin is below a certain magnitude, Audacity just doesn’t display it. When the signal is louder, you have to go farther away from the center frequency to reach that threshold.
That looks… the same. The file with higher bit depth may have slightly less noise, but that won’t affect frequency resolution.
The other thing that might look surprising is the broadband burst of energy when the signal transitions from loud to soft. That’s expected. Amplitude modulation always affects the spectrum – the spectrogram is a correct representation of an instantaneous volume shift, in the frequency domain! If you slow down the transition, the frequency distortion will be less severe, but still present.