I’d like to take something like Linen.kr - with values from 0 to 1 - and shape it into a sine wave, so that it faded it at the beginning and out at the ending.
I considered that I could apply the line to a sine function - something like Linen.kr.sin - but I was hoping to have a little more control over the curvature. I’m sure I’m forgetting something simple - but I bet someone here knows and I’d appreciate the help.
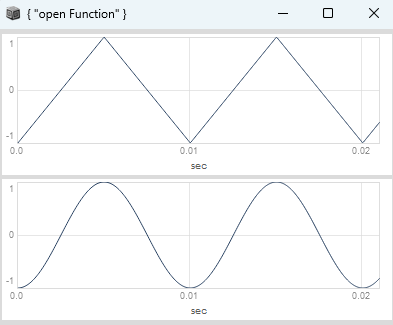
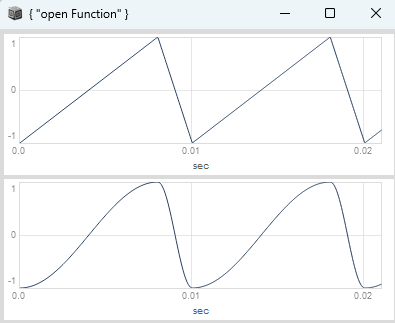
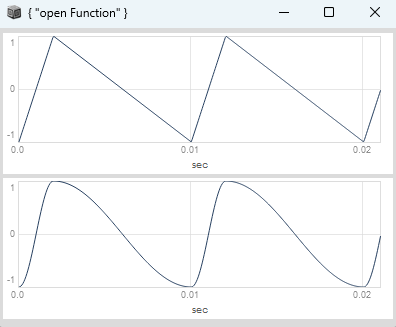
hey, you could for example create a triangle from a Phasor / Line and then run this trough a sin function with the additional tilt parameter to bend the tri / sine to the left and the right. You could then additionally use blend to mix between tri and sine.
This isn’t quite what I was thinking, thank you though… I’d like to map a single line - from 0 to 1 - so that it rises from 0 to 1, then back to 0 - a full cycle. This code seems to create a shaping function and apply it to a repeating waveform…