I think 400 samples is too short a window for the moving sum or average at audio rate, to be visible in a plot.
4 sec * 48000 samp/sec = 192000 samples. 400 samples comprise approx. 0.2% of the graph’s width. My screen is 1400 pix wide ~= 137 pix/sample, so those 400 samples span ~= 3 pix. There are differences in the data but too fine to be visible at this scale.
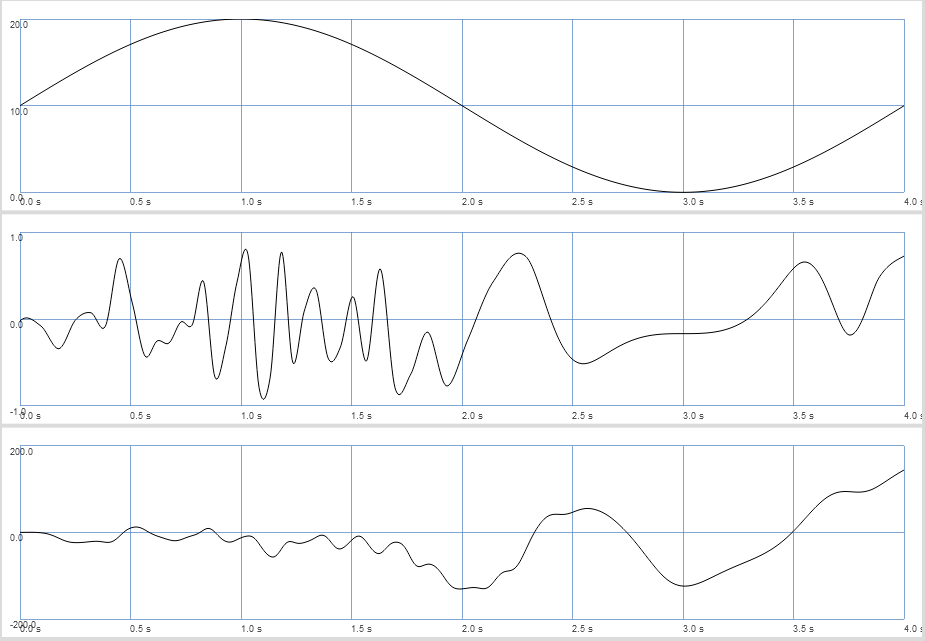
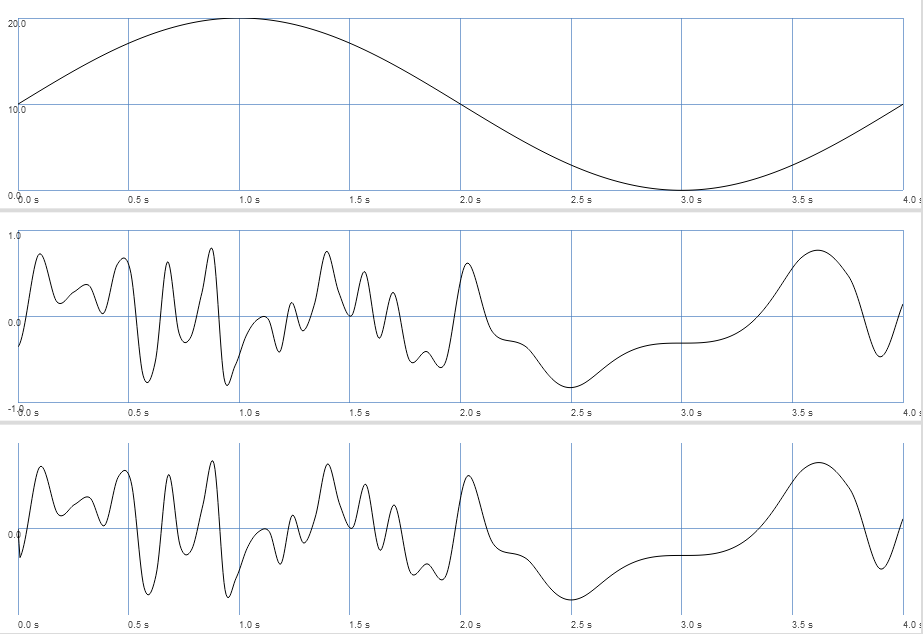
p = { a = LFDNoise3.ar(SinOsc.ar(1/4).range(0,20)); [a, MovingAverage.ar(a, 4000)] }.plot(4);

// this is not a flat 0 plot
(p.plots[0].value - p.plots[1].value).plot