beside being hardly able to understand the following term, I am stuck with plotting it:
(
var t = 2;
f = { ((10 * cos(2pi * (5 * t))) + (5 * cos(2pi * (40 * t)))) * exp(-pi*t**2) };
f.plot;
)
It always gives a warning that the “keyword arg ‘loop’ [is] not found in call to Meta_Object:new” (same goes with ‘dur’ and ‘doneAction’). But where do I call any of them?
I tried several things with .plotGraph, .sampled or to convert this term to an array but nothing helped…
I put it this way to give the Interpreter time to process the function before calling a value on it.
You can’t plot a number. It needs to have a two dimensional value so there is something to plot. A function has specific x and y values, so you can plot that, but a single value is just a value.
I do not fully understand the error messages, but the issue is you want to plot a function, which needs to be evaluated, moreover, your function output a single value.
I think I’m at a loss to how this relates. I’m not good enough at math to really make a connection between the equation and your image. Do you have a source for this?
What you want to be doing is to fill an Array with interpolated values between your desired domain start and end points (here, -1.5 and 1.5) and plot the array. You can do this using Array.interpolation() or by creating a number of points and scaling them to the right range using .linlin.
Note that because of SuperCollider’s precedence rules, exp(-pi*t**2)gives an incorrect result and should be exp(-pi*(t**2)).
(
var numPlotPoints = 1024;
var from = (-1.5), to = 1.5;
var linspace = (0..numPlotPoints).linlin(0, numPlotPoints, from, to);
linspace.collect { |t|
	((10 * cos(2pi * (5 * t))) + (5 * cos(2pi * (40 * t)))) * exp(-pi*(t**2))
}.plot.domainSpecs_([from, to].asSpec);
)
As a shortcut, there’s also Function’s .plotGraph method, which pretty much does the same thing internally and is what I use when I quickly want to plot a mathematical function:
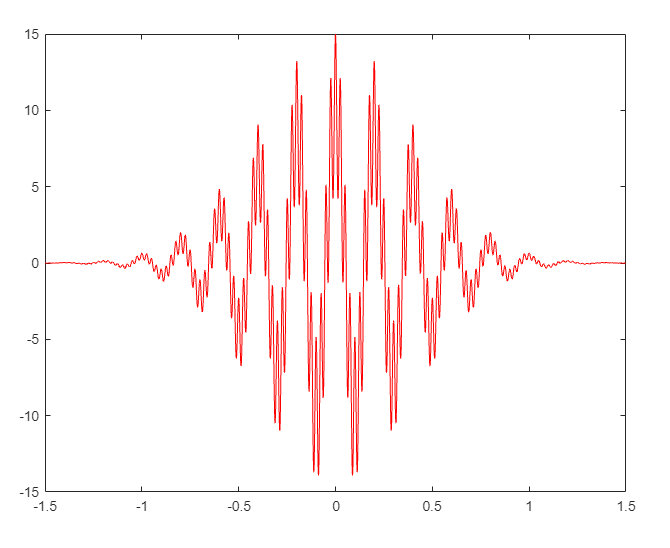
Seems to work exepct that one can only see half of the waveform. Was exploring around with domainSpecs and so but @bovil43810 has got my solution - thank you!
There’s a tricky detail that prevents that snippet from producing your desired graph (aside from the precendence bit). Compare the following:
(
{
	var t = Line.ar(-1.5, 1.5, 0.01);
	var pow1, pow2, pow3, pow4;

	pow1 = t.pow(2);
	pow2 = t ** 2;
	pow3 = t.squared;
	pow4 = t * t;

	[pow1, pow2, pow3, pow4]
}.plot;
)
As you can see, .pow and ** don’t work the way you might think they do inside UGen graph functions. pow(a, b) is actually defined as sign(a) * pow(abs(a), b) when it is used as a BinaryOpUGen, as documented here. There’s also a forum thread that goes into detail on why that implementation actually makes sense. Compare this to the same operation done on the language side:
(
var t;
var pow1, pow2, pow3, pow4;

t = (0..1024).linlin(0, 1024, -1.5, 1.5);

pow1 = t.pow(2);
pow2 = t ** 2;
pow3 = t.squared;
pow4 = t * t;

[pow1, pow2, pow3, pow4].plot; // all give same result
)
Here’s a corrected version that produces the desired result:
That behaviour cost me at least a couple of hours of puzzling and debugging over the course of my SC journey thus far, so I’m glad to spread the word… It’s not like it’s underdocumented really, just a very common beginner pitfall. Apparently it’s pretty much standard in DSP land to define pow that way, though. Just make sure to use pow(abs(a), b) to reflect the language-side behaviour when translating math functions into UGen code.