Hi, this is not an exact answer to your question. But I felt like sharing, and it does match your title (:
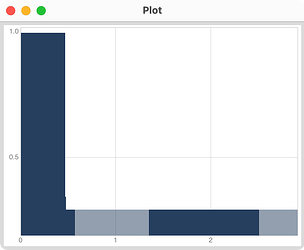
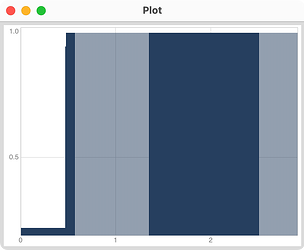
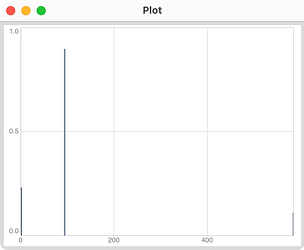
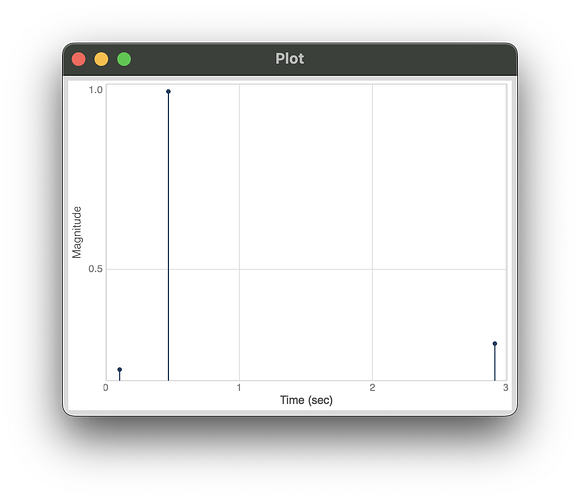
I made the following class, which allows you to record from a multichannel control or audio rate bus, and store it as a csv file. I use Octave (an opensource alternative to matlab) to read the data and make plots.
I guess its not perfect, just notice that I do not free the synth. But anyhow helps me out.
TimeTrace {
    // send the values you want to record to a bus, specify the path were you want to store it, and the record time, recording directly starts
    // example: TimeTrace.new(~bScopeAr, "C:/Users/piert/MakingMusic/SuperCollider/Data Analysis", 10);
    var <>bus, <>buffer, <>synth, <>file;
    *new { |bus_, path_, time_ = 10|
        ^super.new.init(bus_, path_, time_);
    }

    init { |bus_, folderPath_, time_|
        var path, synthDef;
        bus = bus_;
        path = folderPath_ ++ "/" ++ "data_" ++ Date.localtime.stamp ++ ".csv";
        file = File(path, "w");
        if(file.isOpen){
            "Data is being collected".log(this);
            if(bus.rate == \audio){
                synthDef = SynthDef(\timeTraceAr, { |busIndex, bufnum|
                    var input;
                    input = In.ar(busIndex, bus.numChannels);
                    RecordBuf.ar(input, bufnum: bufnum, offset: 0.0, recLevel: 1.0, preLevel: 0.0, run: 1.0, loop: 0.0, trigger: 1.0, doneAction: Done.freeSelf);
                });
                Server.default.makeBundle(nil, { // makeBundle in combination with sync can be used to make sure actions at the server are executed in the right order (not sure why it does not work with Routine, I then get on error about synth.onFree, so apparantly it does not wait with executing)
                    synthDef.send(Server.default);
                    buffer = Buffer.alloc(Server.default, Server.default.sampleRate * time_, bus.numChannels);
                    Server.default.sync;
                    synth = Synth.new(\timeTraceAr, [\busIndex, bus.index, \bufnum, buffer.bufnum], addAction: 'addToTail');
                });
                synth.onFree({ this.export });
            }{
                synthDef = SynthDef(\timeTraceKr, { |busIndex, bufnum|
                    var input;
                    input = In.kr(busIndex, bus.numChannels);
                    RecordBuf.kr(input, bufnum: bufnum, offset: 0.0, recLevel: 1.0, preLevel: 0.0, run: 1.0, loop: 0.0, trigger: 1.0, doneAction: Done.freeSelf);
                });
                Server.default.makeBundle(nil, {
                    synthDef.send(Server.default);
                    buffer = Buffer.alloc(Server.default, Server.default.sampleRate / Server.default.options.blockSize * time_, bus.numChannels);
                    Server.default.sync;
                    synth = Synth.new(\timeTraceKr, [\busIndex, bus.index, \bufnum, buffer.bufnum], addAction: 'addToTail');
                });
                synth.onFree({ this.export });
            };
        } {
            Error("File % could not be opened.".format(path)).throw;
        };
    }

    stop {
        synth.free;
    }

    export {
        buffer.loadToFloatArray(action: { |data|
            var sampleRate;
            if(bus.rate == \audio){
                sampleRate = Server.default.sampleRate;
            }{
                sampleRate = Server.default.sampleRate / Server.default.options.blockSize;
            };

            // Write CSV header
            file.write("time (s),amplitude\n");

            // Write each sample with timestamp
            for(0, data.size/bus.numChannels-1){ |i|
                // since it is a multichannel unlaced array, we have a one dimensional array which consists of the values at one time stance, and the after the values at the next timestance
                // index i corresponds to the timestep, index j to the channel
                var time = i / sampleRate;  // Convert index to time in seconds
                var string = time.asFloat.asStringPrecF;
                for(0, bus.numChannels-1){ |j|
                    string = string + "," + data[i*bus.numChannels+j].asFloat.asStringPrecF;
                };
                string = string + "\n";
                file.write(string);
            };
            /* data.do { |sample, i|
                var time = i / sampleRate;  // Convert index to time in seconds
                 file.write(time.asFloat.asStringPrecF + "," + sample.asFloat.asStringPrecF + "\n");
            }; */

            file.close;
            "Buffer data saved to CSV with timestamps!".log(this);
        });
    }
}


