Something @jamshark70 and @code2music were working on.
Easiest to show with code
~bad = { |level|
	{                               // << this nesting is the issue
		if(level > 0) {
			~bad.(level - 1)
		} {
			Error("meow").throw
		};
	}.();
};

~good = {|level|
	if(level > 0) {
		~good.(level - 1)
	} {
		Error("meow").throw
	};
};
~badTimes = 17.collect {|i|
	var now = Main.elapsedTime;
	try { ~bad.(i) };
	Main.elapsedTime - now;
};

~goodTimes = 17.collect {|i|
	var now = Main.elapsedTime;
	try { ~good.(i) };
	Main.elapsedTime - now;
};
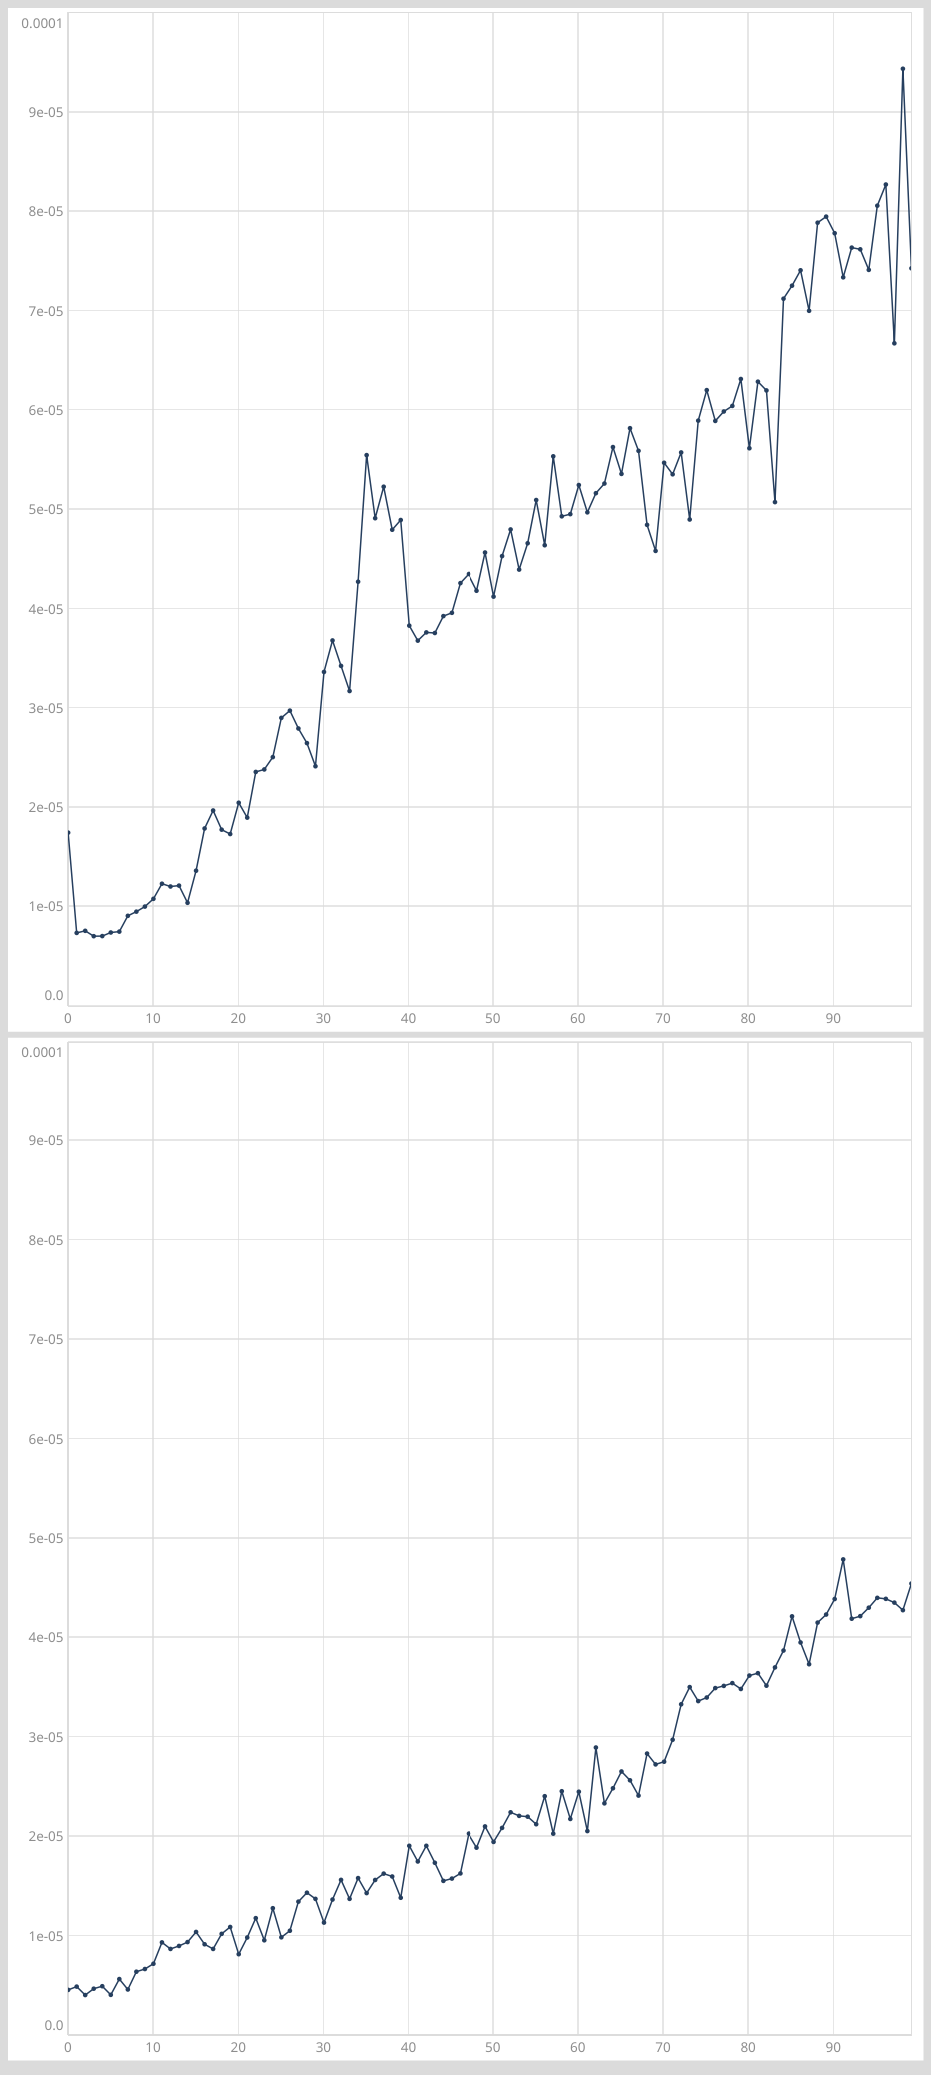
[~badTimes, ~goodTimes].plot(separately: false)
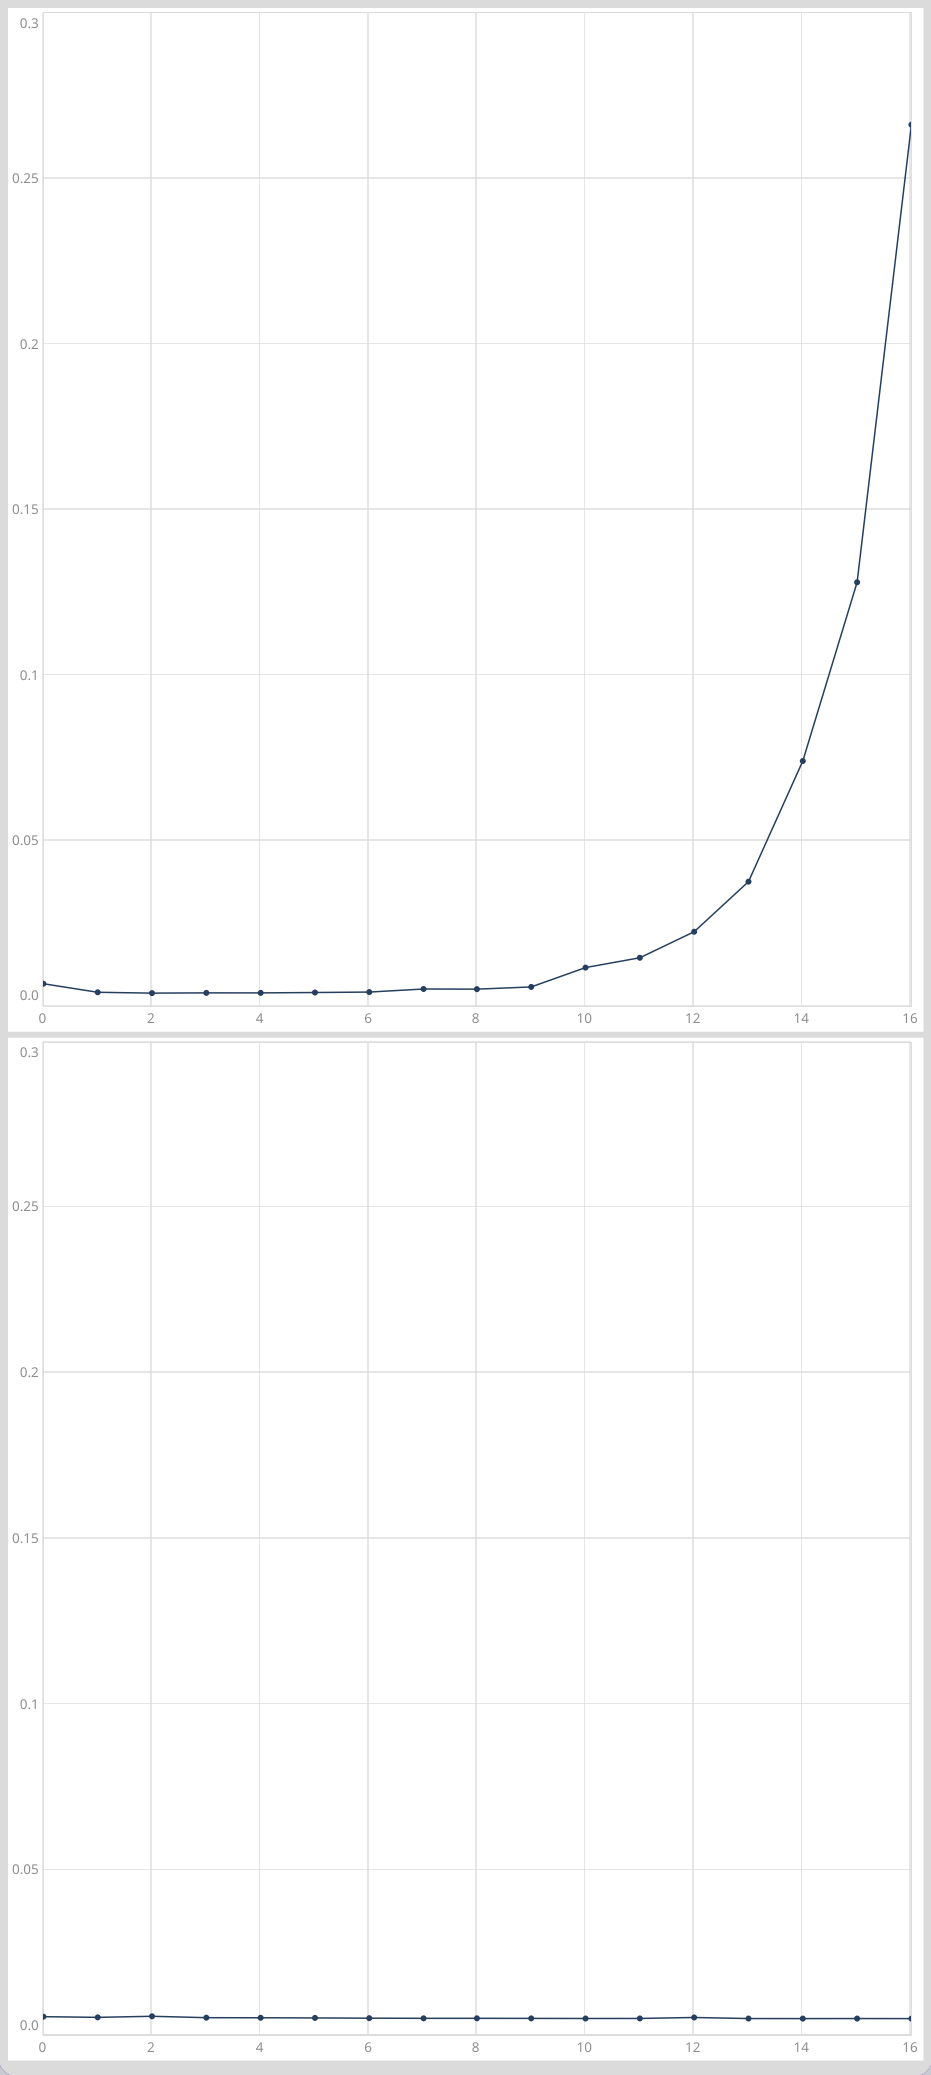
As you can see, the plot of the tested recursion inside of try scaled super-linearly and the non-nested version, when shown on the same scale, can’t even be seen.
@jamshark70 this is the protect issue we were discussing, as protect wraps the function.
If you remove the throwing code, perform scales linearly. It seems to be the act of throwing nested function is the cause of the issue.
If you add an extra wrapper around the bad code, the performance is even worse.
Despite the fact the if statement in the function body looks like a nesting, it isn’t because the compiler inlines it.
This is a bit of conjecture and might be wrong as it right on the limits of the knowledge.
I haven’t spent too long looking into this but this is what I think is happening…
I don’t think the old frames are ever removed from the frame stack as sc implements try by (in my opinion) abusing the return operator ^.
In sc when an error is thrown the current thread’s exception handler is called, passing in the error.
If this is nil, then Nil.handleError is called which calls Object.halt, this clears the vm.
However, in the case of try, the exception handler is the following function…
{ |error|
   thread.exceptionHandler = next; // pop
   ^error
};
Note, that is storing a function with a return ^ to be called by another function later.
When throw is called, this calls that stored functions, making void returnFromMethod(VMGlobals* g) walk all the way up the linked list of frames until it finds the one it expects to return. The execution then continues from there. However, it does not unlink the frames it just called. It needs to otherwise they can’t be recycled by the GC. I think this might be the issue, but don’t have time to look into this more.