Scsynth underperforming compared to other Jack clients

One of my conclusions from a previous thread (SuperCollider on Linux) is that on my machine, scsynth is suffering from Jack xruns at much lower CPU loads than other Jack clients. My machine is an Intel nuc running Ubuntu, properly configured to do audio work.

For a test I modified a simple Jack command line client to allow for increasing its load and specifying the amount of increase by means of a command line argument. You can find the source code here.

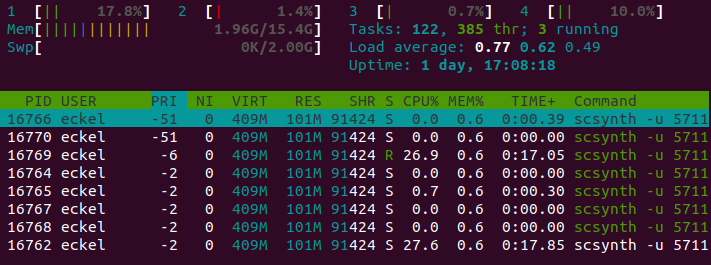
The phenomenon I observe is that for any given Jack block size, scsynth starts to show xruns at considerably lower CPU load values (in htop) than the test client under otherwise identical conditions.

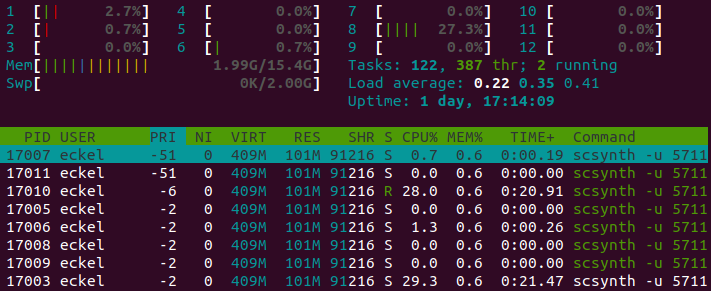
I can for instance run the test client at a CPU load of 85% and get no xrun for a minute. With scsynth I can only go up to 25%.

Here is my test in detail, running with an external USB audio interface at 44.1 kHz with Jack settings of 256 frames/period and 2 periods/buffer:

% extra-load-jack-client 17000 : 85%

scsynth running from scide the code below : 25%

(test code suggested by @jamshark70)

(
Server.default.waitForBoot({
	SynthDef(\sin10, { |out = 0|
		Out.ar(out,
			(SinOsc.ar(
				NamedControl.kr(\freq, Array.fill(10, 440))
			).sum() * 0.0005).dup()
		)
	}).add();
	Server.default.sync();
	n = Array.fill(400, {
		Synth.new(\sin10, [freq: Array.fill(10, { exprand(200, 800) })])
	});
});
)

n.do(_.free);

I would be very much interested to know how this test works out on other machines. The particular configuration of the machine or Jack doesn’t matter for the test. The only interesting aspect to know is if scsynth also underperforms compared to other Jack clients (I also used pd before for comparison).

So the question is how much difference there is in CPU load between scsynth and other Jack clients at the point where they don’t suffer from xruns for a certain time interval and under otherwise identical conditions.

For your test you would adjust the argument to extra-load-jack-client (17000 in my case) and the number of synths in SC (400 in my case).

2 Likes

[off topic]

while (n-- > 0);

Usually, compilers will completely optimized this away because it has no effect. This only works because you (implicitly) compile with -O0. At -O1 the loop already gets removed.

You have to add some actual work to the loop. However, it must have a real side effect. An easy trick is to write the result to a volatile global variable.

Here’s a comparison between three different loop bodies: Compiler Explorer
Note how in the first two functions the loop completely disappears.

Good catch. Thank you. I implemented your suggestion. Could you perform the test?

I will try this when I can. Great work so far. This is very interesting !

Running the SC-code from the IDE: 44-46% CPU in htop with a couple of xruns every minute or so when idling and all the time if I use my computer, like open a browser tab or write this message.

Running the SC-code from the terminal using sclang: 42-44% CPU in htop with xruns but much less often, every 2-3 minutes or so. Lots of xruns when using the machine for other things.

Running extra-load-jack-client 9000: 69-72% CPU in htop, no xruns whatever else I do on the machine.

So SuperCollider through IDE or terminal are very close CPU-wise, around 44% and both produce many xruns, seemingly related to graphics and typing. The extra-load-jack-client produces no xruns even at 70% and is not bothered about what else is going on with the machine.

Thank you @ludo! It is interesting to see that in your case the difference in achievable CPU load is smaller than in my case. It’s still quite a bit though.

Thank you! I am looking forward to your results!

My result is similar to ludo’s. Built-in soundcard, 256-sample buffer, “performance” CPU governor.

  • extraload: 70% CPU, 8200 wait cycles
  • SC: 47-48% CPU, 4000 sines

BTW I found a way to make it easier to test different numbers of synths:

(
var num = thisProcess.argv[0].asInteger;

Server.default.waitForBoot({
	SynthDef(\sin10, { |out = 0|
		Out.ar(out,
			(SinOsc.ar(
				NamedControl.kr(\freq, Array.fill(10, 440))
			).sum() * 0.0005).dup()
		)
	}).add();
	Server.default.sync();
	n = Array.fill(num, {
		Synth.new(\sin10, [freq: Array.fill(10, { exprand(200, 800) })])
	});

	loop {
		[s.avgCPU, s.peakCPU].postln;
		1.0.wait;
	};
});
)

Then: sclang sine-script.scd 400 will play 400 synths = 4000 sines, sclang sine-script.scd 350 = 350 synths = 3500 sines etc.

Also SC reports slightly higher CPU use if I start dragging windows around. (So there is definitely some negative interaction between the graphics system and JACK’s audio threads.)

~~

Here’s one thing I’m suspicious about: “With scsynth I can only go up to 25%” but most of us are reporting being able to go up to nearly 50%.

I’m not sure about details, but I wonder if this could somehow be related to the number of cores. It’s remarkably convenient that eckel’s hitting a limit at just about exactly 1/4… if coincidental, that would be stunning.

My laptop is an Intel Core i5 = 2 physical cores, 4 virtual cores with hyperthreading. (I know I’m supposed to turn hyperthreading off, but I didn’t.) I’m getting into xrun territory just below 50% ~= 1 of 2 physical cores.

eckel’s screenshots in the other thread show 12 cores. Here’s where the math breaks down, of course – 1/6 physical cores would be 16.7% – but still – AFAICS nobody has been able to reproduce a paltry 25% limit, so there is something different about that machine, and we know that machine has more cores than others that have been tested. It’s premature to rule this out as a variable.

~~

I’ll be honest that I’m not 100% convinced by the methodology. A busy-wait loop isn’t quite the same as calling into multiple UGen calculation functions, with memory accesses (UGen member variables – a few thousand instances, whose memory locations may be spread out, possibly affecting CPU RAM caching – and wire buffers for passing audio blocks between units, and Out audio-bus writes).

I would guess that a loop that is doing almost nothing is more likely to have a smooth CPU usage profile, which would xrun less often.

My finding with a Pd patch that fairly closely matches the SC script was that Pd started glitching with a higher CPU percentage, but roughly the same or a smaller oscillator count. What I take from this is that the amount of work being done does not necessarily correlate with CPU percentage. Also, the Pd patch produces a very strange falling-pitch phenomenon, which SC doesn’t – so Pd is using more CPU to do a bit less work, and lower-quality work – but if you look only at the CPU numbers, then you would conclude that Pd is “better” at making use of processor resources. For these reasons, I’m skeptical of giving too much attention to CPU percentages. (Yet, the entire methodology here is focused almost entirely on CPU percentages.)

(EDIT: I have to retract that one point: The falling pitches are reproducible in SC, if I quantize the random numbers to 10000 exponentially-spaced steps… it must be a fascinating phase-cancellation property of exponential distribution. So Pd’s result is actually comparable to SC’s – but I discovered the phenomenon first in Pd because I’m not aware of a full floating-point precision random function in Pd.)

If SC hits a limit at, say, half of the simple client’s CPU reading, I think we should be very careful to avoid the assumption that SC “should” be able to do twice as much work. It may simply not translate.

With that said, 25% seems awfully low to me. If it turns out that the number of cores is not a factor, then that does sound like something is wrong.

hjh

1 Like

I performed the test on macOS 10.13.6. With both the test client and running the test code by @jamshark70 with sclang I can reach a bit more than 60% of CPU load without having an xrun for a minute. I only had to add this line:

Server.default.options.device = "JackRouter";

Here are my numbers:

sclang sine-test.scd 800
extra-load-jack-client 6500

Well, running the SuperCollider code always gave me xruns, Sorry for being unclear, I didn’t investigate what the lowest count of synths that would not give any xruns at all was.

A quick test now suggests that in order to be completely free of xruns while running the code from the IDE is around 30-35%, so more than 25% but still far from the test client.

James McCartney pointed out in a podcast that CoreAudio features some proprietary magic to make it much easier to achieve low latencies than Windows or Linux can manage – so it’s an interesting finding but may not shed much light on Linux.

FWIW when I’m using my USB soundcard with a 256-sample buffer, in my live setup I can often hit above 50%, even 60% sometimes, without glitching (though I don’t want to stay in that range for a long time).

So we’ve got 2 people on this thread whose Linux machines struggle around 25-30% – is there anything in common between those machines?

hjh

I performed the test on another macOS, 10.15.7 this time. I was running scsynth with native Jack support like on Linux:

sclang sine-test.scd 750: 75%
extra-load-jack-client 9000: 83%

With hyperthreading turned off:

sclang sine-test.scd 800: 80%
extra-load-jack-client 9000: 83%

I unfortuately donẗ have a RT kernel on this computer but I just ran a quick test with Arch’s vanilla kernel (5.12.14-arch1-1 #1 SMP PREEMPT which is pretty good anyways).

sclang sine-test.scd 900 is where mine starts to xrun with avg cpu at 57%. I start getting some xruns at 800 as well and with the cpu at 53%.

with extra-load-jack-client 13000 I start getting sporadic xruns at 78% CPU.

This is the output of realTimeConfigQuickScan for reference:

== GUI-enabled checks ==
Checking if you are root... no - good
Checking filesystem 'noatime' parameter... 5.12.14 kernel - good
(relatime is default since 2.6.30)
Checking CPU Governors... CPU 0: 'performance' CPU 1: 'performance' CPU 2: 'performance' CPU 3: 'performance' CPU 4: 'performance' CPU 5: 'performance' CPU 6: 'performance' CPU 7: 'performance'  - good
Checking swappiness... 10 - good
Checking for resource-intensive background processes... none found - good
Checking checking sysctl inotify max_user_watches... >= 524288 - good
Checking whether you're in the 'audio' group... yes - good
Checking for multiple 'audio' groups... no - good
Checking the ability to prioritize processes with chrt... yes - good
Checking kernel support for high resolution timers... found - good
Kernel with Real-Time Preemption... not found - not good
Kernel without 'threadirqs' parameter or real-time capabilities found
For more information, see https://wiki.linuxaudio.org/wiki/system_configuration#do_i_really_need_a_real-time_kernel
Checking if kernel system timer is high-resolution... found - good
Checking kernel support for tickless timer... found - good
== Other checks ==
Checking filesystem types... ok.
** Set $SOUND_CARD_IRQ to the IRQ of your soundcard to enable more checks.
   Find your sound card's IRQ by looking at '/proc/interrupts' and lspci.

oh and my computer has CPU: Intel i5-8265U (8) @ 3.900GHz

Mine is an Intel NUC i7 6-Core 10710U (1,1 GHz, 4,7 GHz Turbo) running Ubuntu using a Behringer UMC202HD USB-interface for my tests. Here is the output of the realTimeConfigQuickScan script:

== GUI-enabled checks ==
Checking if you are root... no - good
Checking filesystem 'noatime' parameter... 5.8.0 kernel - good
(relatime is default since 2.6.30)
Checking CPU Governors... CPU 0: 'performance' CPU 1: 'performance' CPU 10: 'performance' CPU 11: 'performance' CPU 2: 'performance' CPU 3: 'performance' CPU 4: 'performance' CPU 5: 'performance' CPU 6: 'performance' CPU 7: 'performance' CPU 8: 'performance' CPU 9: 'performance'  - good
Checking swappiness... 10 - good
Checking for resource-intensive background processes... none found - good
Checking checking sysctl inotify max_user_watches... >= 524288 - good
Checking whether you're in the 'audio' group... yes - good
Checking for multiple 'audio' groups... no - good
Checking the ability to prioritize processes with chrt... yes - good
Checking kernel support for high resolution timers... found - good
Kernel with Real-Time Preemption... 'threadirqs' kernel parameter - good
Checking if kernel system timer is high-resolution... found - good
Checking kernel support for tickless timer... found - good
== Other checks ==
Checking filesystem types... ok.
** Set $SOUND_CARD_IRQ to the IRQ of your soundcard to enable more checks.
   Find your sound card's IRQ by looking at '/proc/interrupts' and lspci.

I have the same processor but mine gets 50~60% with sclang sine-test.scd 900, may I ask what brand/model is your laptop and at which speed is running? (lscpu informs that).

There is a little scam (sorry, I’m also pissed off about this) with intel cpus, their performance strongly depends on the cooling solution and thermal throttling may be drastic in some laptops, like mine, or small case desktops. Also if the mobo isn’t good or has bad drivers they can get more heat and less power and you may not ever know why.

I am not sure if you were asking me, @lucas. In any case, my test machine is not a laptop but an Intel NUC Mini-PC. When I run the test, lscpu reports around 4 GHz.

Wouldn’t the scam you mention affect both scsynth and the test client in the same way?

Yes, I very well understand your concerns about the methodology. But what would be a better one?

Is there a simple way to measure the smoothness of CPU load? A Jack client that logs the Jack CPU for every block?

How can we find out, why all tests on Linux so far showed that scsynth can load the CPU less without provoking xruns than the test client?

On macOS, I haven’t seen a significant difference yet, both when using native Jack (on 10.15.7) or the JackRouter bridge (on 10.13.6). It would be great to get more samples from macOS.

I investigated this a bit by deactivating 8 of the 12 cores on my machine. The results are very similar. I am running your test code in sclang with 450 as argument. Anything higher will produce an xrun in the first minute at a block size of 256. The average and peak loads you are printing are all the time almost the same value around 26, occasionally hitting 30. Here are the two htop outputs, the first one with only 4 and the other one with all 12 cores:

I used this as root to dis/enable cpu<n>
echo {0,1} > /sys/devices/system/cpu/cpu<n>/online

I compiled SC 3.10.0 and ran the test with it. I can reach 54% of CPU load without xruns for at least one minute and with 900 as command line argument to sclang. Twice as much as with 3.11.2!