the window looks a bit weird on the plot, but the result is crazy:
(
var rampToSlope = { |phase|
	var history = Delay1.ar(phase);
	var delta = (phase - history);
	delta.wrap(-0.5, 0.5);
};

{
	var rate = 1000;
	var phase = (Phasor.ar(DC.ar(0), rate * SampleDur.ir) - SampleDur.ir).wrap(0, 1);

	var slope = rampToSlope.(phase);
	var sampleCount = phase - (slope < 0) / slope;
	var trig = sampleCount < 1;

	var subsampleOffset = Latch.ar(sampleCount, trig);
	var accum = Duty.ar(SampleDur.ir, trig, Dseries(0, 1));

	var windowSlope =  slope / \overlap.kr(1);
	var windowPhase = Latch.ar(windowSlope, trig) * (accum + subsampleOffset);
	var window = IEnvGen.ar(Env([0, 1, 0], [0.5, 0.5], \sin), windowPhase);

	var sig = SinOsc.ar(slope * SampleRate.ir * \grainRate.kr(2)) * window;

	sig!2 * 0.1;
}.play;
)

s.freqscope;
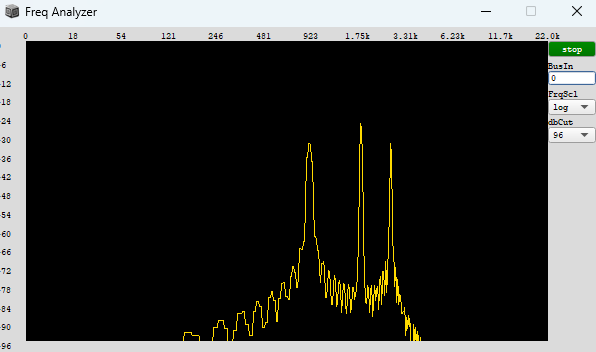
with subsampleOffset:
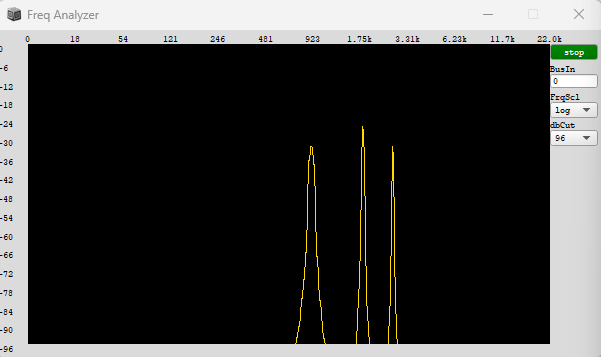
and without subsampleOffset: