I would be surprised if the GUI threads interfered with the scsynth audio thread
I find that I can provoke xruns by moving windows around or rapidly maximizing and minimizing windows even when the CPU usage on one core is moderate and the others are at 0%. So there seems to be some interaction, somehow. I agree that it is surprising.
I didn’t set a small buffer size – I went with 1024 because my intent was not to provoke xruns, but rather to see if there was an observable difference under a normal, usable setup.
Load my live coding environment.
free all of the instruments except one.
Play a specific pattern at a specific tempo – because of the Voicer, this will cap at 20 waveguide synths (so there’s a consistent load to measure).
Then I did this in three environments: A/ IDE, B/ commandline sclang, but running my performance load script (which creates sclang GUI windows), and C/ commandline sclang issuing live-coding commands directly (no GUI windows).
A minus B = IDE
B minus C = Qt windows belonging to sclang
After making sure I controlled for all variables (in a couple of tests, there were some mixers I forgot to delete), I found that all three environments reported about 31% CPU usage (from scsynth, which I believe is the most relevant measurement, since it’s actual execution time for one hardware block / hardware block duration).
I repeated the tests with hardware buffer = 256 samples, and found
A. (IDE) ~32% (but with occasional xruns – built-in soundcard, which I know to have suboptimal performance)
B. (sclang + GUI) 32.5%
C. (sclang no GUI) 32-32.5%
One conclusion that might be drawn is that perhaps the performance at 64 samples doesn’t predict real-world performance of a system that is actually usable on stage. In a performance, I typically use 256 samples (which works well on my system with a USB soundcard), and in that configuration, I find that GUIs introduce no difference in performance that is outside of a reasonable margin of error. (When the readings for one environment fluctuate within +/-1 or 2%, a half-percent difference between A, B or C doesn’t matter.)
While doing all that and posting this reply in Firefox, I get xruns with running this piece of code from the IDE with the 64 frames and 2 periods Jack setting and an external USB sound card:
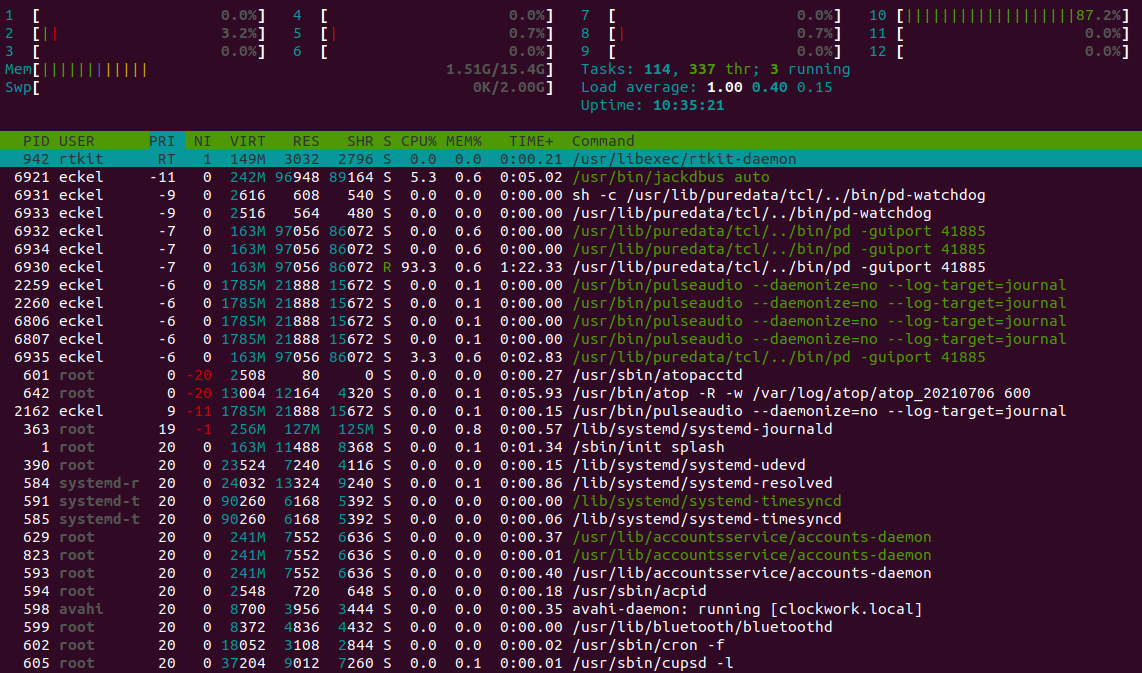
Jack (and SC, which uses the Jack load) and htop report a load of about 35%. Too little in my opinion to accept xruns. There has to be a way to improve this if pd and other Jack clients can do it and SC can do it when run headless.
I hit maxNodes at about 35% CPU with a couple xruns reported, but not a cascade of them.
I have to suspect system tuning in your case. Something in my system is giving SC sufficient priority to run well, and you seem not to have that something in your system. I’m afraid I don’t know what that thing is, though.
{ SinOsc.ar }.play is not only a sinewave. It’s actually a sinewave plus an envelope generator and a multiplier (and if mul != 1, actually two multipliers). At least this.
If Pd is simply summing sine waves while the SC test is structured around Function:play, then SC is being asked to do more work. It’s hard to evaluate this as the contents of the Pd patch haven’t been shared.
Benchmarking really should avoid convenience methods (as these are a good way to leave uncontrolled experimental variables floating around).
Yes, I agree with your observations. My main goal with all these tests is to use a maximum of performance per core. The actual number of sine waves is not so important for me but to know that I don’t waste resources. In the case of Pd this goal seems to be met better in my current configuration.
I’ve hesitated adding my own anecdote here because it’s just one data point. But it seems like it may be relevant:
I bought one computer in ~2014 and used it for years with SC (and didn’t update the SC version much). I bought another machine in 2018/2019 which was much faster (much better CPU, much more RAM, etc), but the newer machine was much more prone to hitting xruns. So much so that I switched back to the 2014 computer to play live shows.
I ran the Realtime Config Quick Scan on both machines and they had exactly the same results. Jack and scsynth settings were identical. Both using the same external USB audio interface.
I don’t know if it was the hardware or the SC version or something else, but notably I was not using the GUI at all - just running scsynth/supernova on the command line.
I’ve still got both setups so I can run benchmarking tests if they’d be helpful.
Thanks for sharing. I think this investigation is important. I agree that it is tricky with this kind of anecdotal evidence, but I think @eckel is doing a good job of providing straightforward numbers to support the idea that something is up. Perhaps we could put together some form of test suite and then rally some users with different machines and setups to run them to get a bigger data set and thereby understand the problem better?
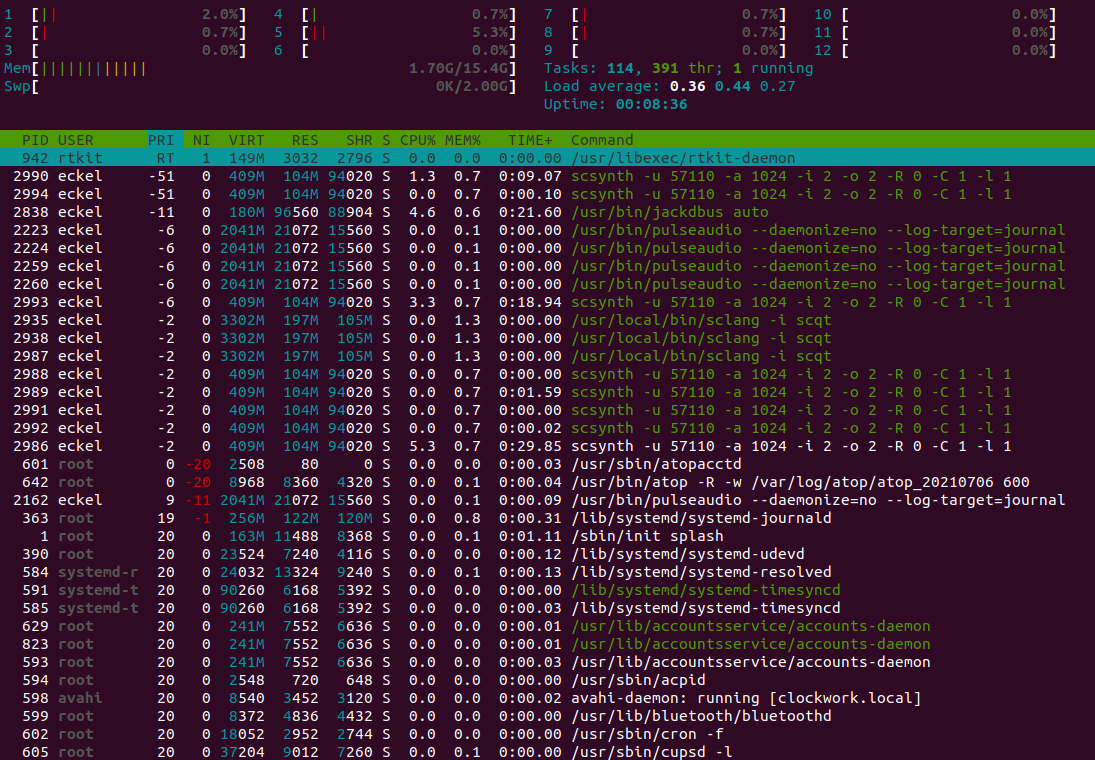
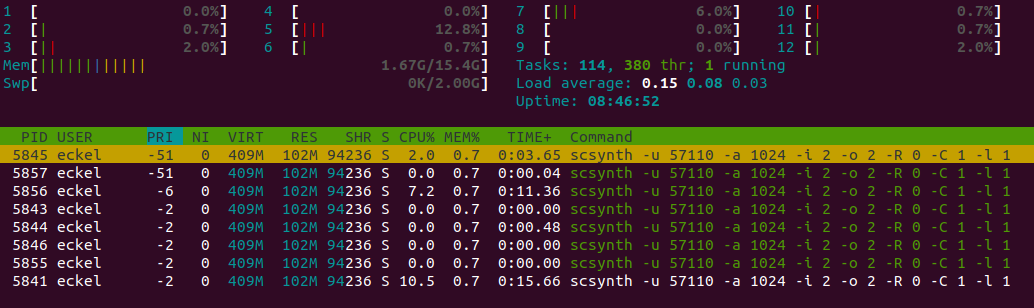
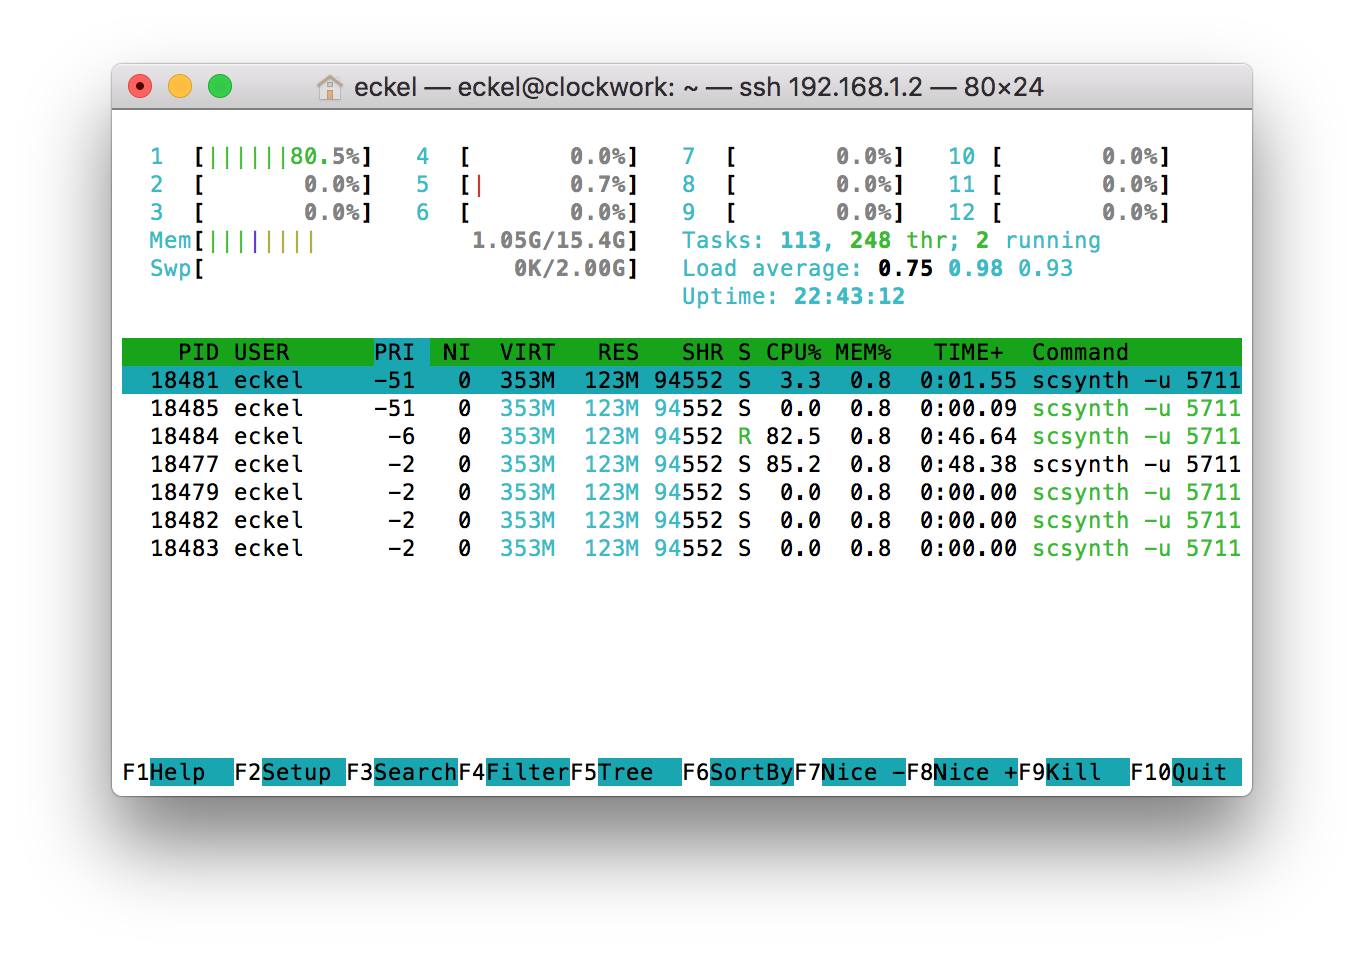
It seems that the threads with PRI -51 are kernel threads (green). The user thread has a PRI of -2.
The black/white entry is the main process (thread), the green entries are the additional threads. scsynth’s main thread has low priority (-2) and the audio thread has high priority (-51).
You could try to run jackd at a higher RT priority than scsynth, e.g. jackd -R -P 54 ...