Hello,
I thought the following two code blocks will output the same graphics, but the sig in the second code block terminated when the duration of the last plot is reached. Why does it happen?
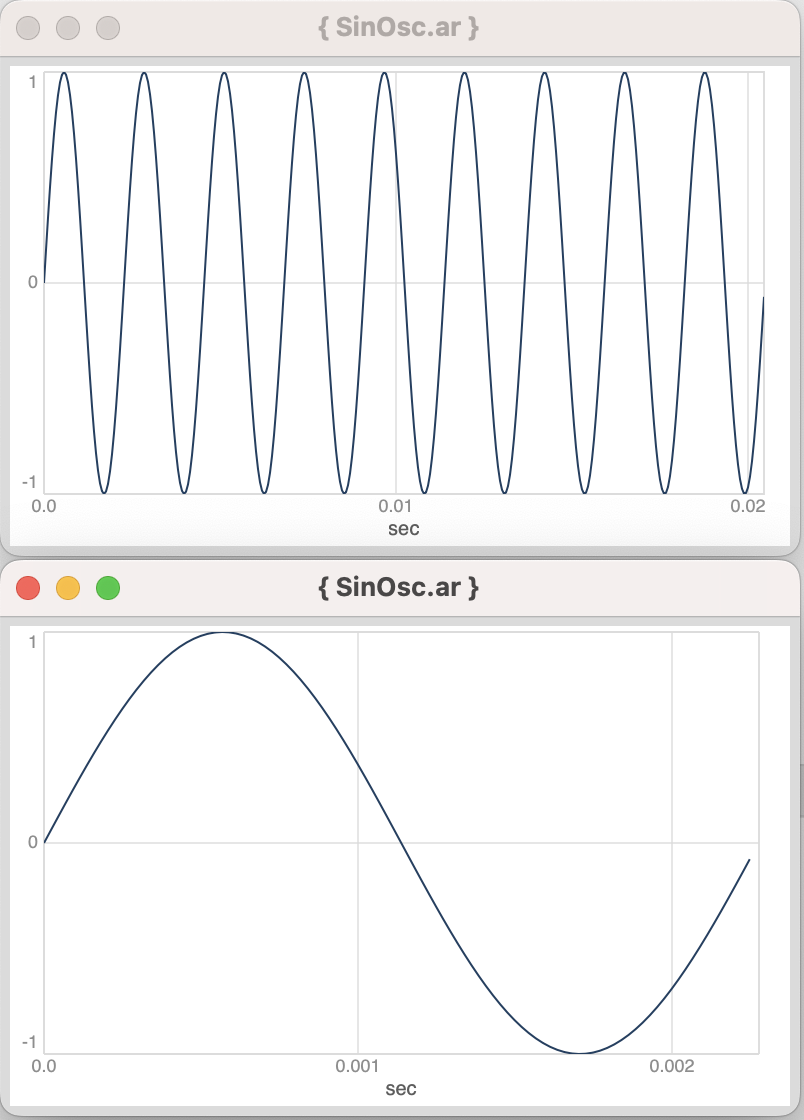
(
s.waitForBoot {
		var freq=440, sig1 = { SinOsc.ar }, sig2 = { SinOsc.ar };
		sig1.plot(freq.reciprocal * 9, bounds: Rect(0, 250, 400, 250));
		sig2.plot(freq.reciprocal, bounds: Rect(0, 530, 400, 250))
}
)
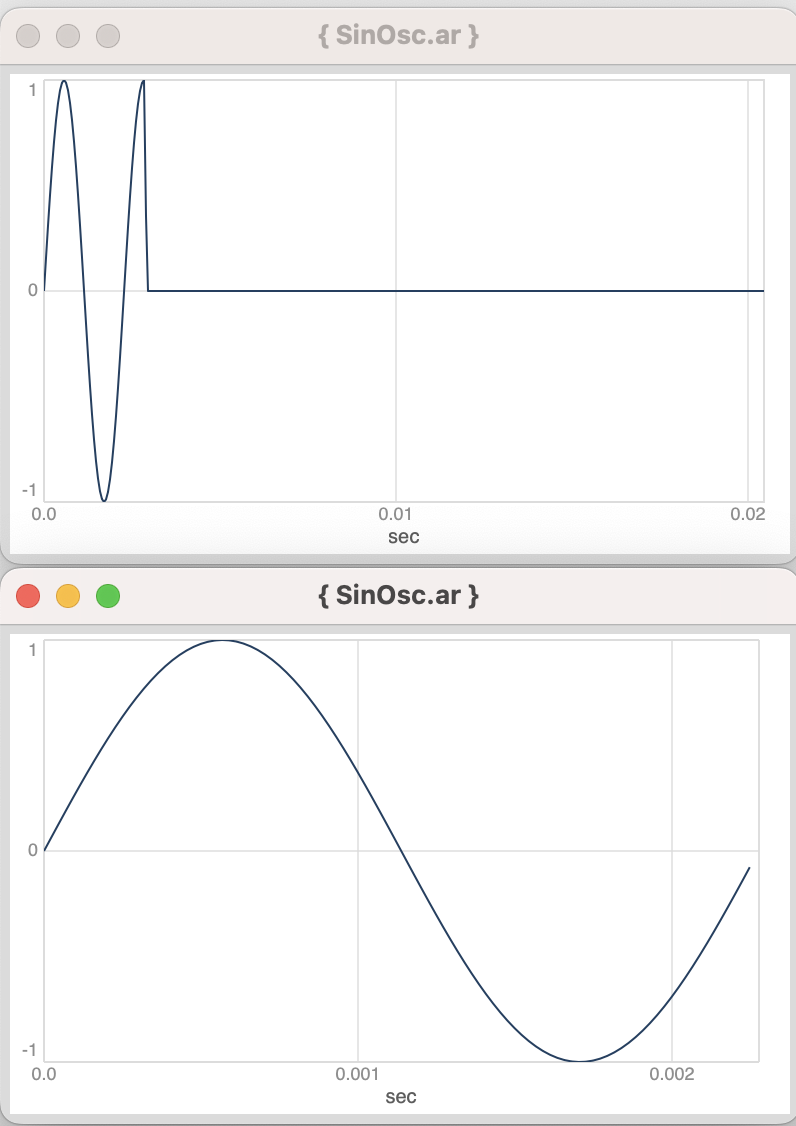
(
s.waitForBoot {
		var freq=440, sig = { SinOsc.ar };
		sig.plot(freq.reciprocal * 9, bounds: Rect(0, 250, 400, 250)); // plot 1.
		sig.plot(freq.reciprocal, bounds: Rect(0, 530, 400, 250)) // plot 2.
		// The duration of plot 2 affects the `sig` in plot 1. why?
}
)