Would it be a Plotter’s plot resolution related phenomenon?
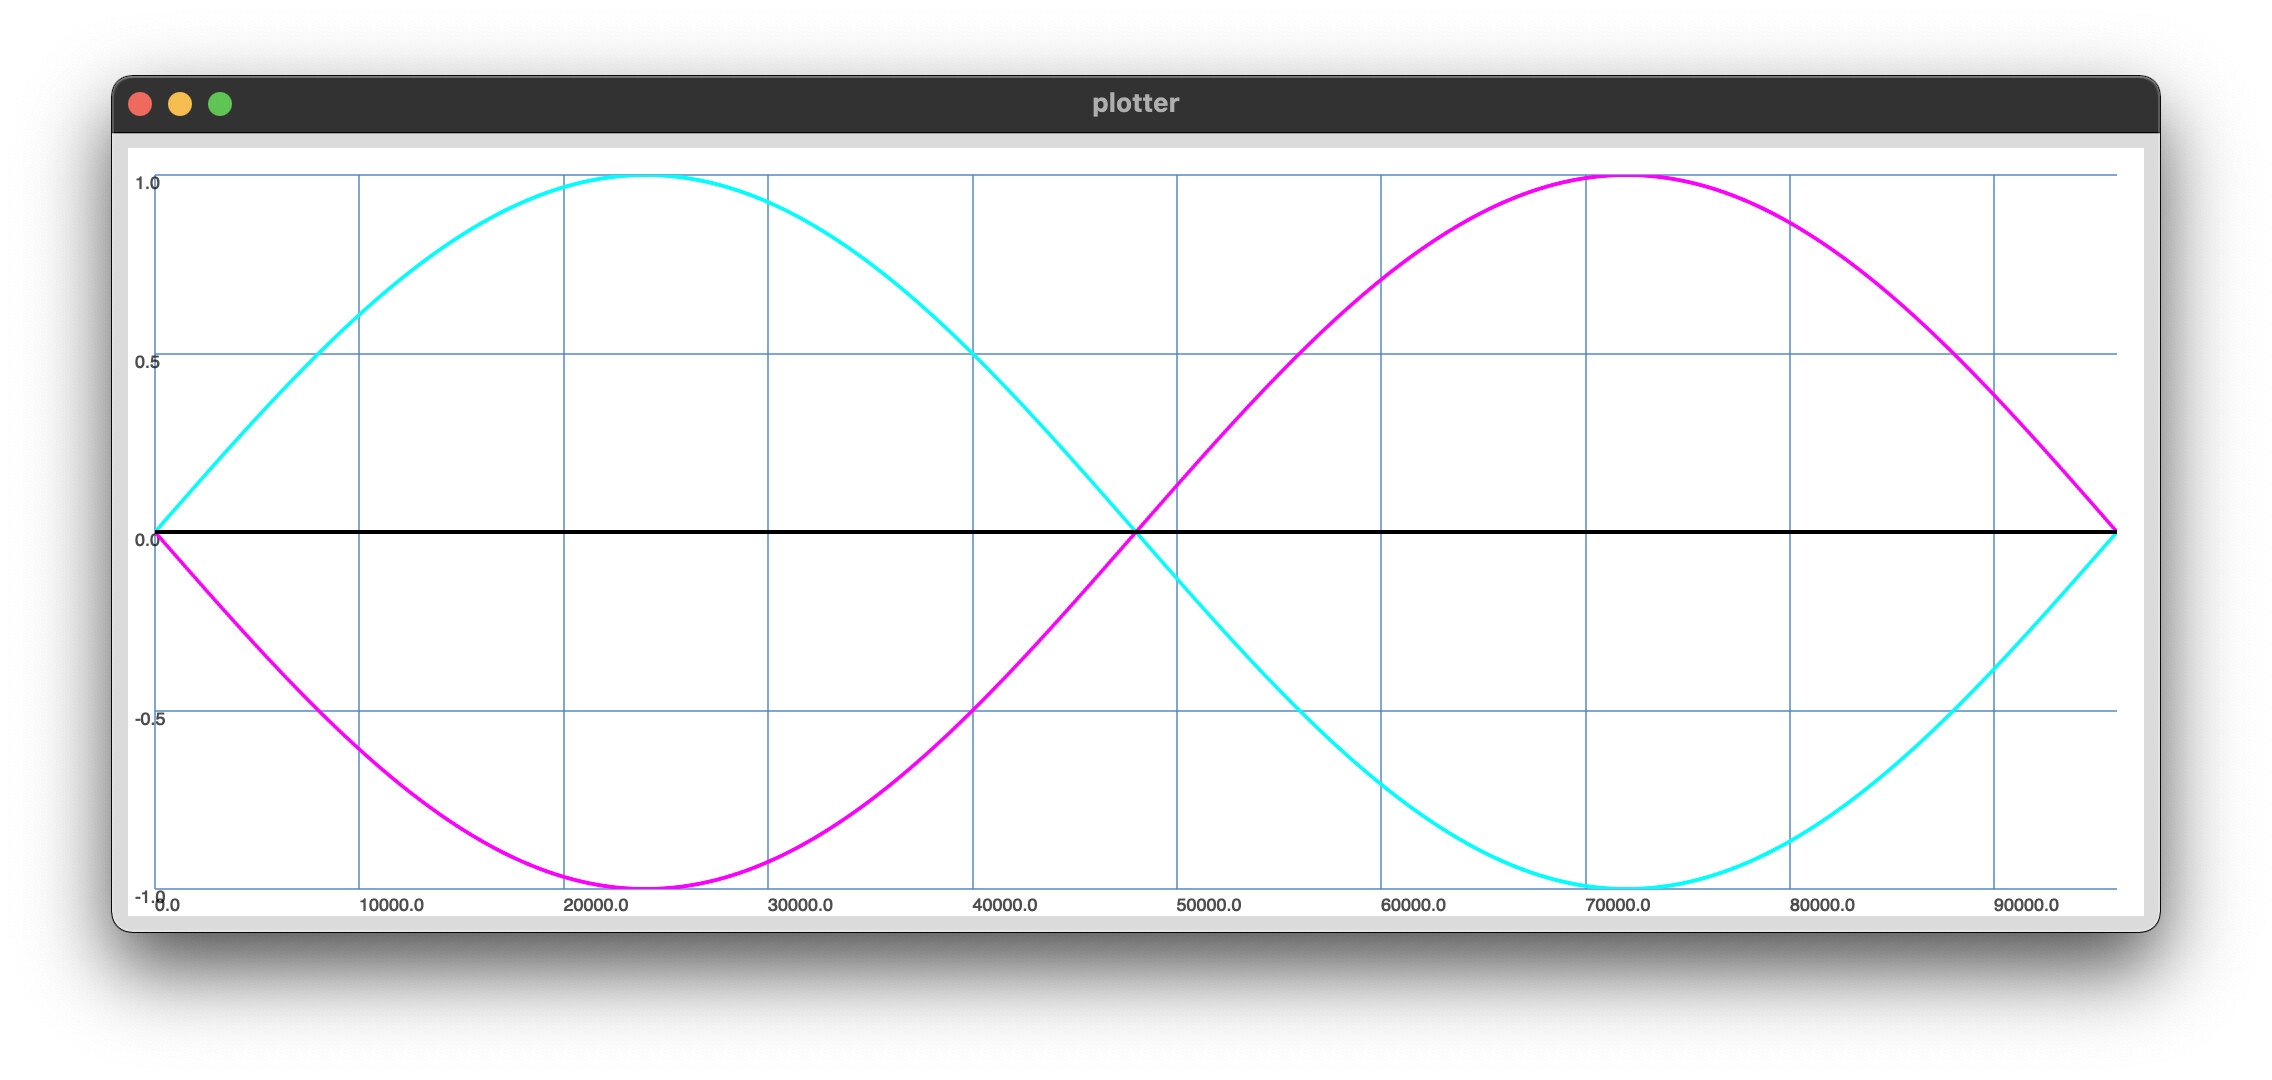
// case 1 - I think this would be right result
(
x = Signal.sineFill(s.sampleRate, [1]); //cyan
y = Signal.sineFill(s.sampleRate, [1], [pi]); //magenta
z = x + y; // black
)
(
var data = [x,y,z];
var plotter = Plotter("plotter", Rect(0, 0, 1024, 400));
plotter.plotMode = \points;
plotter.value_(data);
plotter.superpose_(true);
plotter.setProperties(
\plotColor, [Color.cyan, Color.magenta, Color.black]
);
);
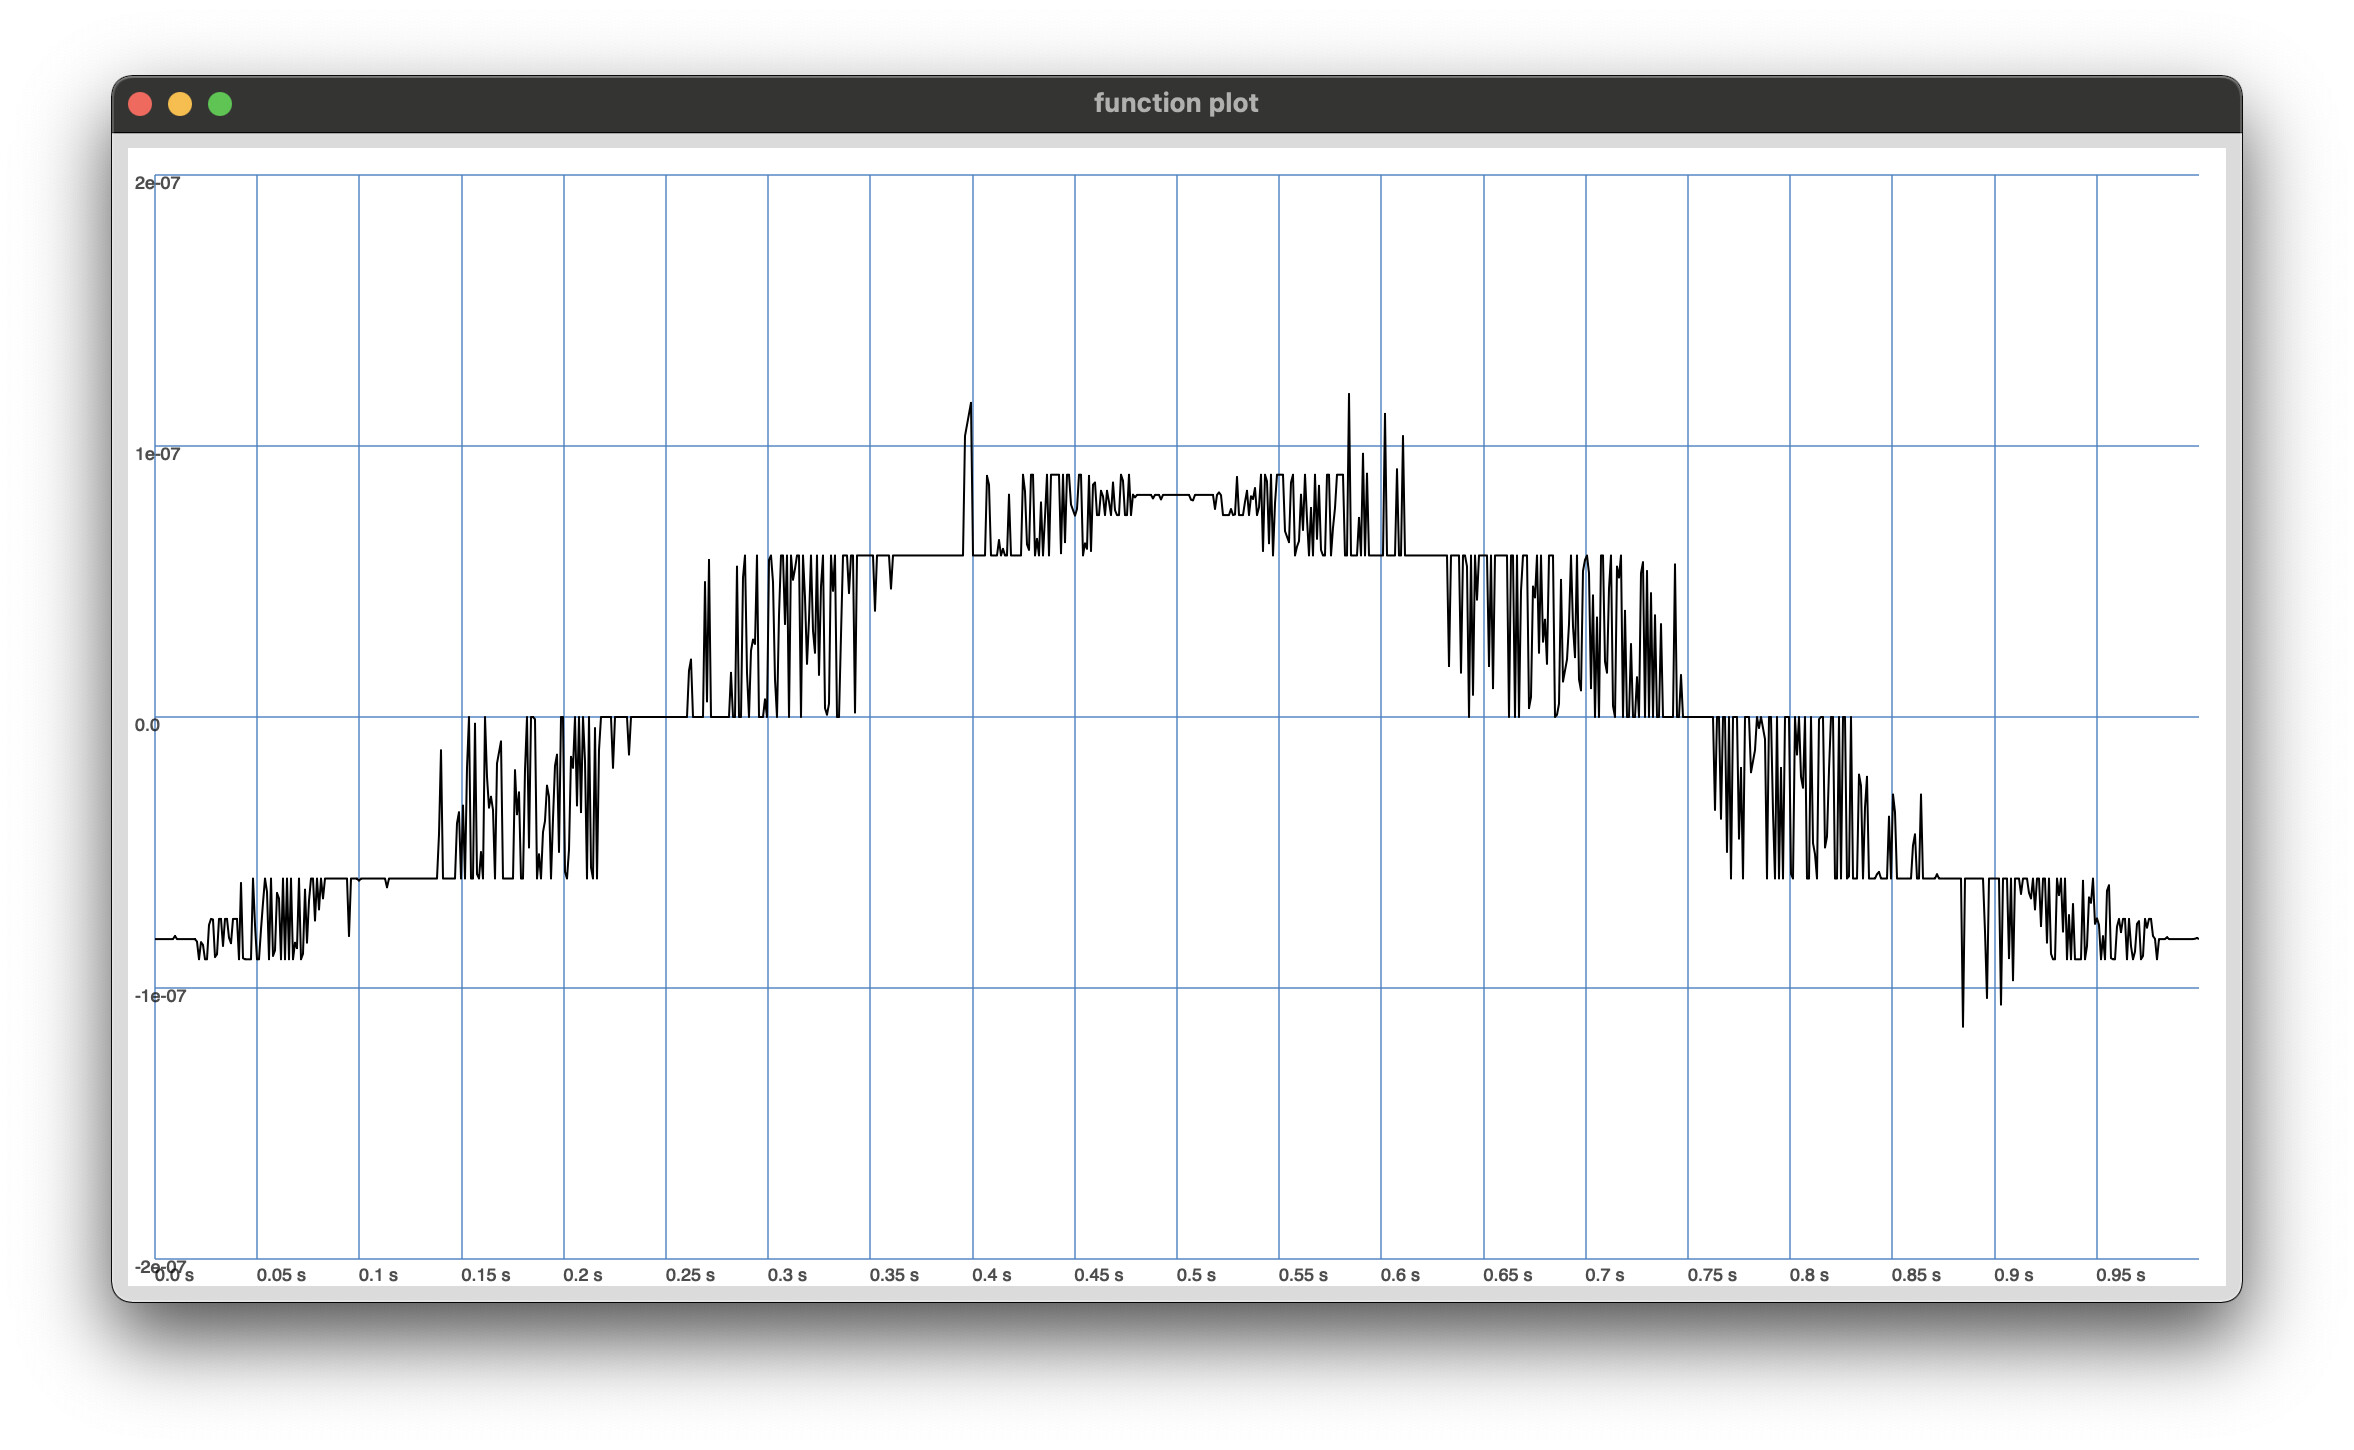
// case 2 - The values are almost zero.. But why not just zero?
({
var env = Env([0, 0.1, 0], [1.0, 0.1]);
SinOsc.ar(1, 0) + SinOsc.ar(1, pi)
}.plot(1);)
The range of the second graph is -0.0000002 to 0.0000002.
These are not large numbers.
The only time you will ever get pure mathematical precision from floating point numbers is when all numbers are rational and the denominators are only powers of two. Otherwise, rounding error should be expected.
Also, pi cannot possibly be exact as it’s an irrational number (infinite digits), and floating point precision is finite. sin(pi) is not exactly 0 in floating point – and your pi-offset sinewave is thereby not an exact negative of the 0-phase wave.
It won’t let me edit, but I initially misunderstood what’s actually going on in my reply. Only the sine voice should cancel, and that truly is floating point errors as far as I can tell. The others are results of running oscillators really slow and removing the dc offset, so only artifacts remain